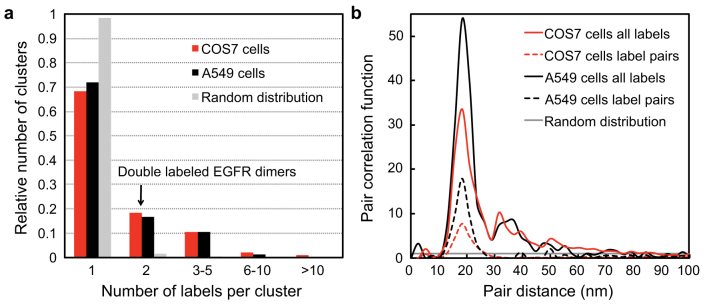
Figure 3. Analysis of the spatial distribution patterns of labeled EGFRs on COS7 and A549 cells.

(a) Size distribution histogram of EGFR clusters in COS7 (red) and A549 cells (black). A total of 20 images (M = 50,000×) for both cell types was first processed to determine the positions of 1411 EGFR labels followed by the application of a density-based spatial clustering algorithm. A random distribution generated by Monte Carlo simulation (grey) is included for comparison. (b) Normalized pair correlation function for both cell types. The peak maxima indicating the likeliest average distance between the two labels are found at 19 nm for both curves. The subsets of labels assigned to a cluster size of two are included as dashed lines. The grey line indicates the level for a random distribution.
