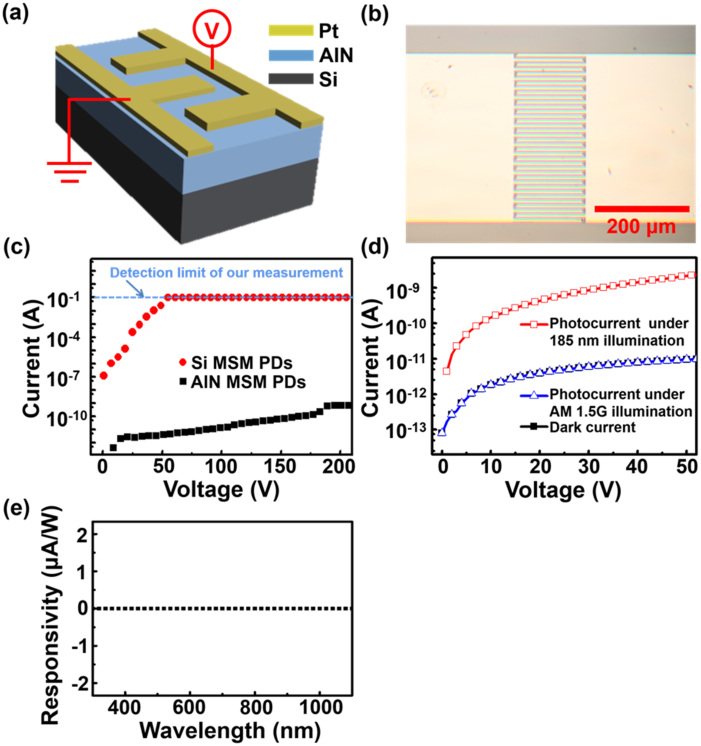
Figure 2. (a) Schematic and (b) optical microscopic image of the AlN MSM PDs.
(c) I–V curves of AlN and Si MSM PDs in the dark. Note that the 0.1 A is the detection limit of the electrical measurements. (d) I–V curves of the AlN MSM PDs measured in the dark and under AM 1.5G illumination and 185-nm light illumination. (e) The wavelength-dependent responsivity of the AlN PDs measured under 5 V bias.

