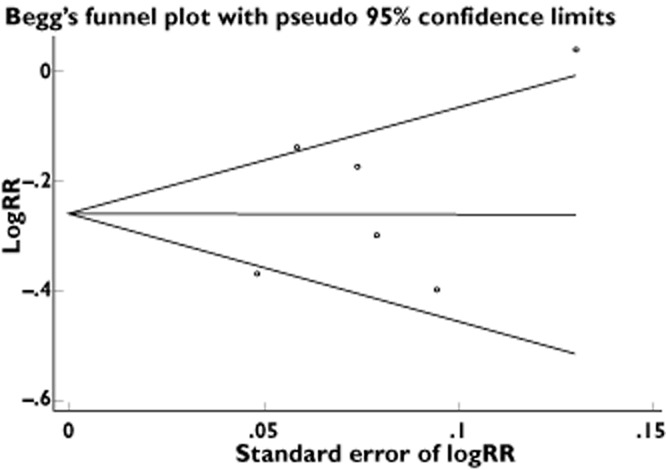
Figure 2.

Funnel plots of the relative risk of developing colorectal cancer, with the standard error, for all studies included in the meta-analysis. Relative risks are displayed on a logarithmic scale. The x-axis represents standard error of log RR, and the y-axis represents log RR. For bisphosphonate use: P = 0.851 for the Begg–Mazumdar test; P = 0.410 for the Egger test
