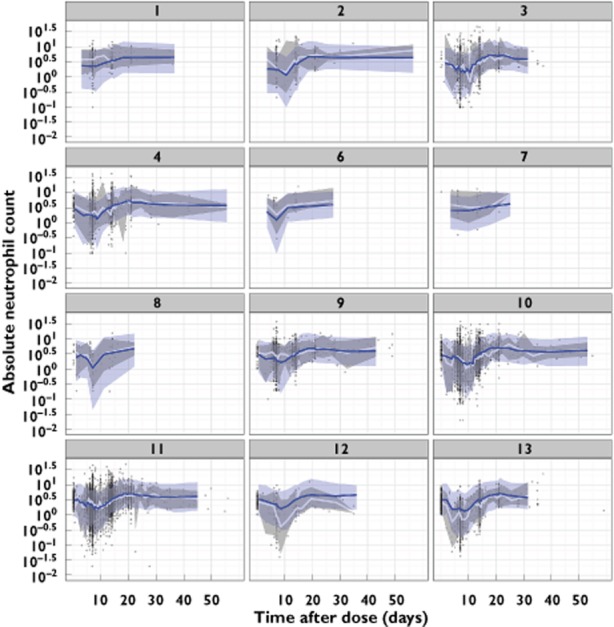
Figure 2.

Visual predictive checks of absolute neutrophil count (×109 cells l−1) vs. time after dose for the final covariate model, by study number. The blue line and area represent the model-predicted median and 90% prediction interval. The white line and grey area represent the observed median and 90% prediction interval
