
Figure 3.
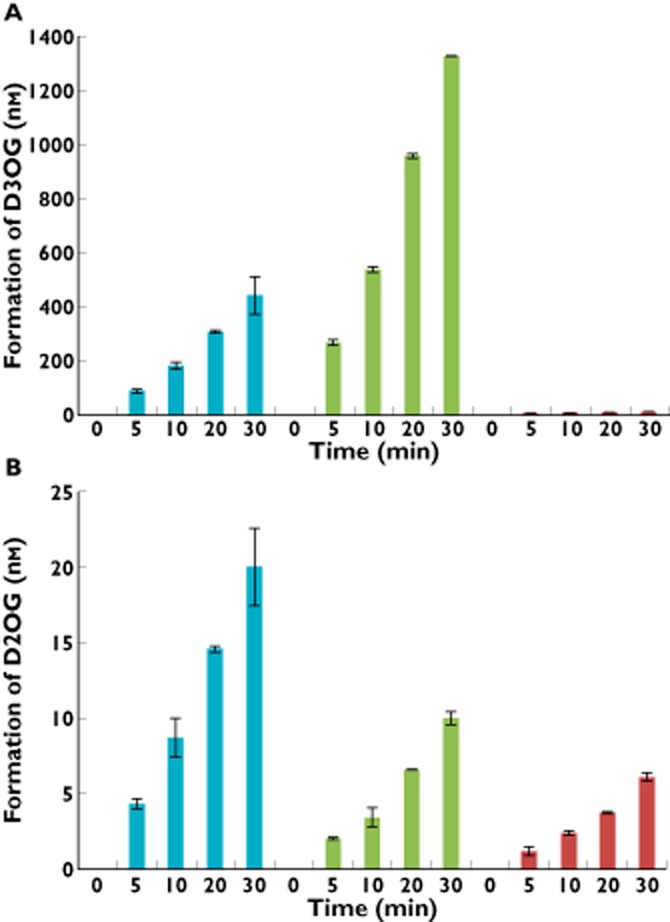
Formation rates of (A) D3OG and (B) D2OG after incubation of dapagliflozin with human kidney, liver or intestine microsomes at a protein concentration of 0.25 mg ml−1 in the presence of uridine 5′-diphosphoglucuronic acid. D2OG, dapagliflozin 2-O-glucuronide; D3OG, dapagliflozin 3-O-glucuronide; T2DM, type 2 diabetes mellitus.  , human liver microsomes;
  , human kidney microsomes;
  , human intestine microsomes