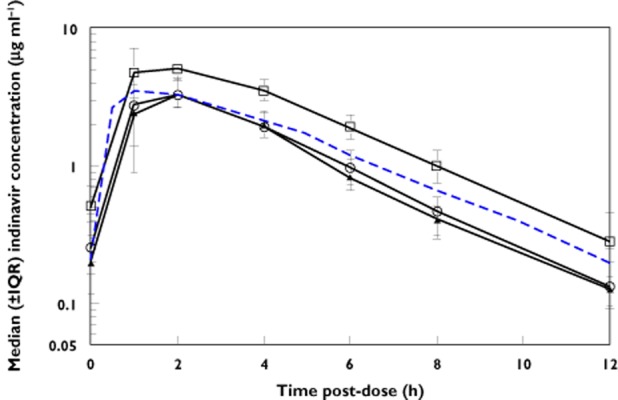
Figure 1.

Median (± interquartile range) indinavir concentration vs. time curves for HIV-infected pregnant women using indinavir/ritonavir 400/100 mg twice daily during the second and third trimesters of pregnancy and post-partum. Dashed line represents the typical 50th percentile concentrations in non-pregnant historical Thai adults.  , second trimester;
  , third trimester;
  , post-partum;
  , non-pregnant
