Figure 4.
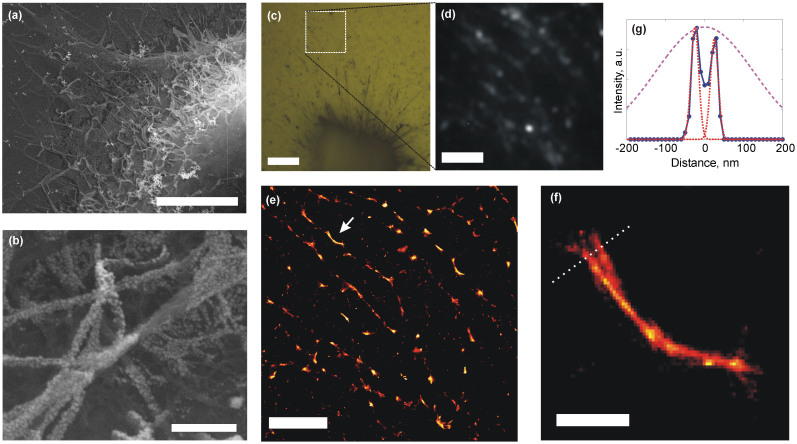
(a) Scanning electron micrograph of the edge of a cardiomyocyte (scale bar 4 μm). (b) Evaporation of 3 nm thick Ag results in spontaneous formation of Ag islands on the sample, with 20 nm average diameter (scale bar 300 nm). (c) Bright field optical micrograph of a collapsed cardiomyocyte covered with a 3 nm mass thickness Ag film (scale bar 7 μm). (d) Frame from a video sequence recorded under wide-field illumination shows blinking events on a fibrillar section of the collapsed cell (scale bar 2 μm, see Supplementary Video 5). (e) Stochastic reconstruction of the video sequence allows improved resolution imaging of the fibrillar structure (scale bar 2 μm). (f) Detail of the region denoted by the arrow in (e) shows that the resolution is significantly below the diffraction limit (scale bar 250 nm). (g) Two features separated by 50 nm are clearly resolved across the cross-section shown by dotted line in (f). Stochastically reconstructed images display fibrillar features whose apparent diameters can be fitted with Gaussian widths of 2σ = 20 nm, while diffraction limited spot would be represented by the broad dashed curve, with a Gaussian width of 2σ = 250 nm.

