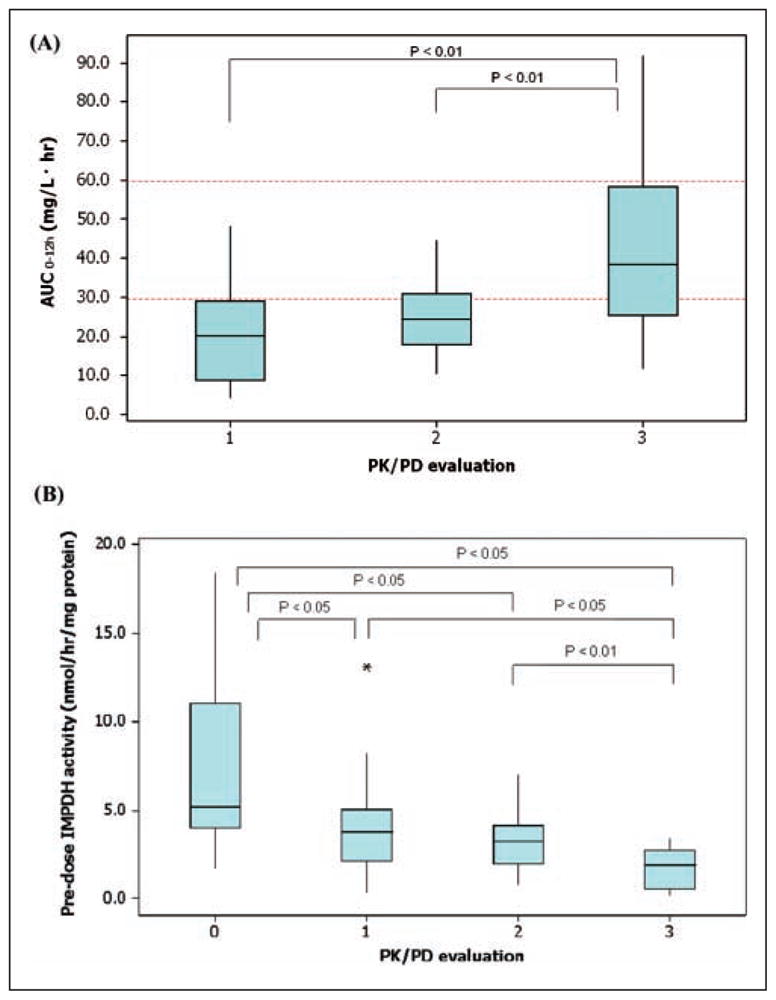
Figure 3.

Box plots of mycophenolic acid (MPA) exposure as measured by the AUC with the current target range (dotted lines)12–15 (A) and the effect as measured by inosine monophosphate dehydrogenase (IMPDH) activity and inhibition (B) over time: (0) pretransplant, (1) early posttransplant, (2) prior to discharge, and (3) at stable mycophenolate mofetil (MMF) treatment. The bottom and top of the box represent the 25th and 75th percentiles, respectively. The 50th percentile (median) is represented by the band near the middle of the box. The ends of the whiskers represent the minimum and maximum data points. Data points represented by a star are considered outliers, defined as outside 1.5 interquartile range of the highest value of all values except the outlier.
