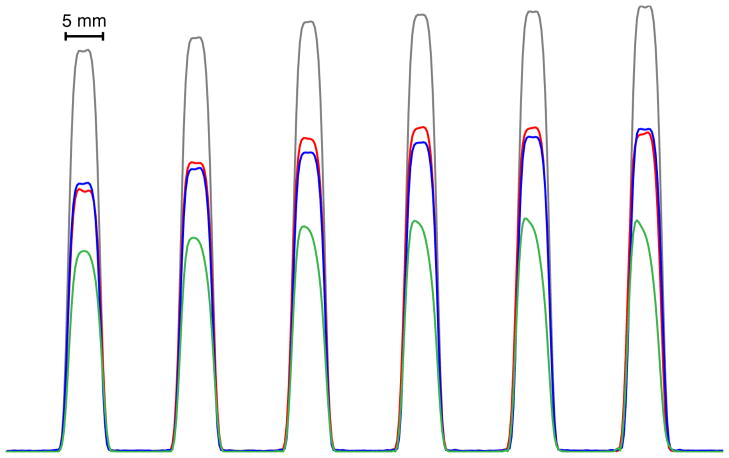
Figure 5.
Slice profiles measured in a cylindrical oil phantom. For reference, slice profiles acquired separately with single-band pulses at the minimum TE of 28 ms are shown in gray. The six slices simultaneously acquired with a time-shifted six-banded RF pulse are shown in red (TE = 38 ms); this is compared to single-band acquisition at the same TE is shown in blue. The same six slices acquired with a stretched conventional six-banded RF pulse are shown in green (TE = 52 ms).

