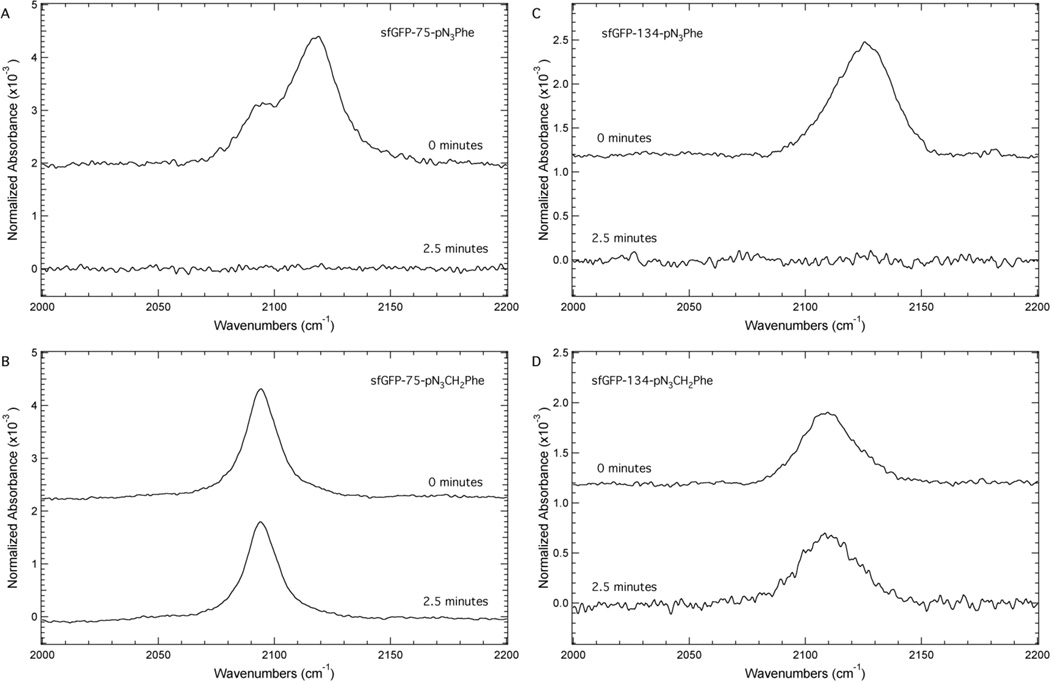
Figure 6.
ATR-FTIR absorbance spectra of sfGFP containing either 2 or 3 at site 75 (Panels A and B) or at site 134 (Panels C and D) in the protein. The protein samples were dissolved to a concentration of ~1 mM in a pH 7.3 aqueous buffer containing 50 mM sodium phosphate and 150 mM sodium chloride. The protein samples were irradiated for either zero or 2.5 minutes with a handheld UV lamp (254 nm, 4 W). The spectra were recorded at 25°C, baseline corrected, and normalized to the Amide I band.

