
Figure 2.
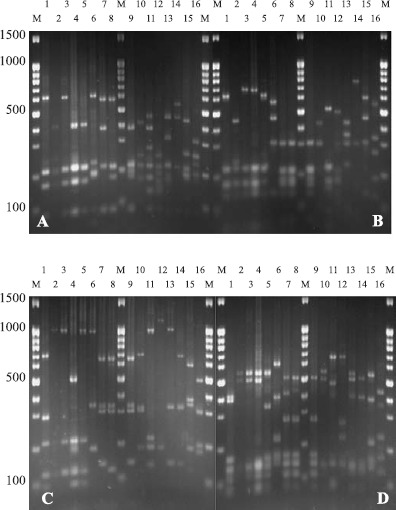
16S-ARDRA patterns obtained from restriction digestion gel photos with Alu I, Hae III, Hinf I, and Msp I. Lanes (1-16) represent the ARDRA groups 1, 2, 4, 7, 10, 11, 12, 13, 14, 17, 18, 21, 24, 25, 26, and 27. Lanes M are the marker 100 bp + 1.5 kb DNA ladder; A, B, C, and D represent restriction digestion gel photos with Alu I, Hae III, Hinf I, and Msp I.