
Figure 3.
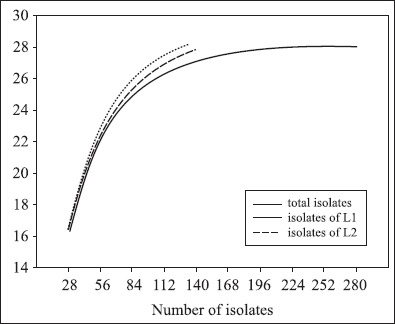
Rarefaction curves for the different ARDRA patterns of all the siderophore-producing bacterial isolates used in this study. The expected number of ARDRApatterns is plotted versus the number of isolates. Rarefaction curves were also calculated for the fraction of L1 and L2. L1: location 1; L2: location 2.