Figure 8.

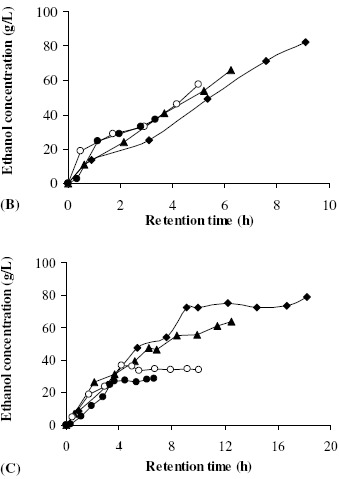
The steady-state ethanol concentration profiles at initial sugar concentrations of 200 g/L (A), 220 g/L (B), and 248 g/L (C) and at superficial velocities of 4.8 cm/h (♦), 6.9 cm/h (▲), 8.7 cm/h (○), and 13.0 cm/h(●).

The steady-state ethanol concentration profiles at initial sugar concentrations of 200 g/L (A), 220 g/L (B), and 248 g/L (C) and at superficial velocities of 4.8 cm/h (♦), 6.9 cm/h (▲), 8.7 cm/h (○), and 13.0 cm/h(●).