Figure 2.

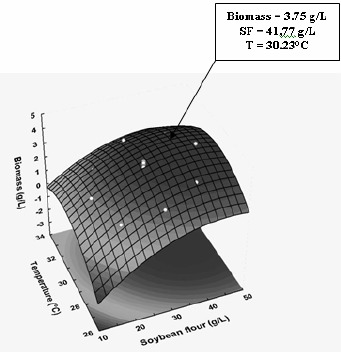
Three-dimensional response surface contour plot showing the simultaneous effects of soybean flour concentration and temperature on biomass concentration.

Three-dimensional response surface contour plot showing the simultaneous effects of soybean flour concentration and temperature on biomass concentration.