
Figure 2.
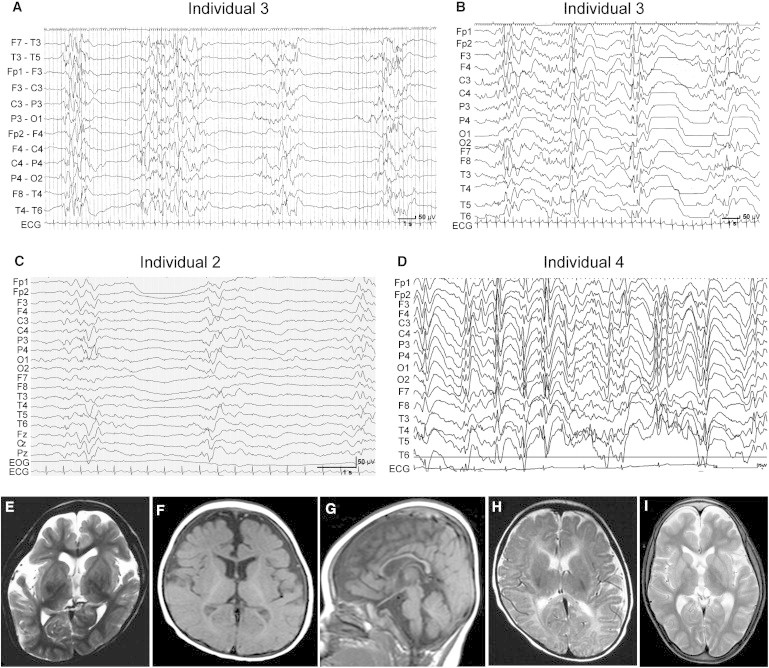
EEG and Brain MRI Features of Individuals with GNAO1 Mutations
(A and B) Interictal EEG of individual 3. A suppression-burst pattern was observed at 2 months of age (A), and transition to hypsarrhythmia was observed at 4 months (B).
(C) Interictal EEG of individual 2 shows a suppression-burst pattern at 2 months.
(D) Interictal EEG of individual 4 shows a diffuse spike- or sharp-and-slow-wave complex at 5 years.
(E–I) T2-weighted axial images through the basal ganglia (E, H, and I) and T1-weighted axial (F) and sagittal (G) images. Individual 1 showed cerebral atrophy at 5 years and 6 months (E). Individual 2 showed delayed myelination and thin corpus callosum at 10 months (F and G). Individual 3 showed normal appearance at 3 months (H). Individual 4 showed reduced white matter at 7 years (I).