
Figure 3.
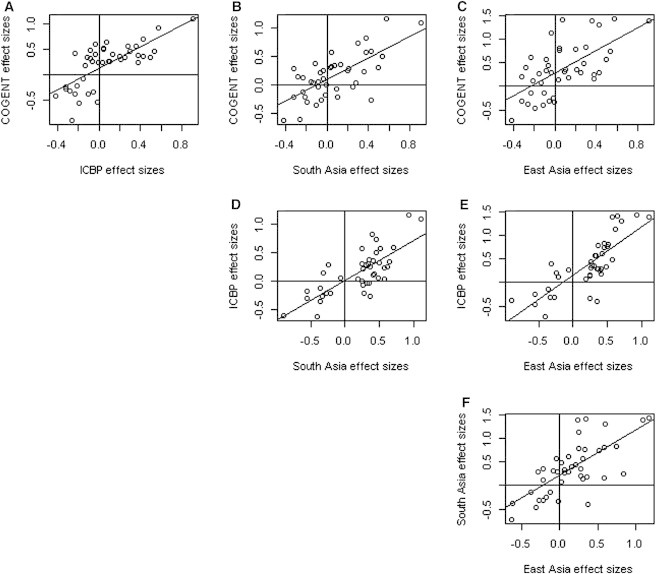
Pairwise Scatter Plots of the Effect Sizes of the 21 ICBP-Reported Variants among the COGENT, ICBP, South Asian, and East Asian Data Sets
The figure is plotted on the basis of the variants after exclusion of eight monomorphic variants in HapMap CHB (Han Chinese in Beijing, China) and JPT (Japanese in Tokyo, Japan) samples. The Pearson correlation coefficients and the corresponding p values are r = 0.72 and p = 8.6 × 10⁻¹¹ (A), r = 0.69 and p = 2.1 × 10⁻⁹ (B), r = 0.64 and p = 8.6 × 10⁻⁷ (C), r = 0.76 and p = 1.4 × 10⁻¹³ (D), r = 0.8 and p = 3.2 × 10⁻¹⁷ (E), and r = 0.7 and p = 3.2 × 10⁻¹⁰ (F). We observed that the effect sizes are highly correlated across the different ethnic populations. These results strongly suggest that many common variants consistently contribute to BP variation across ethnicities, although replication is challenging because of variation in LD, sample size, and allele frequency.