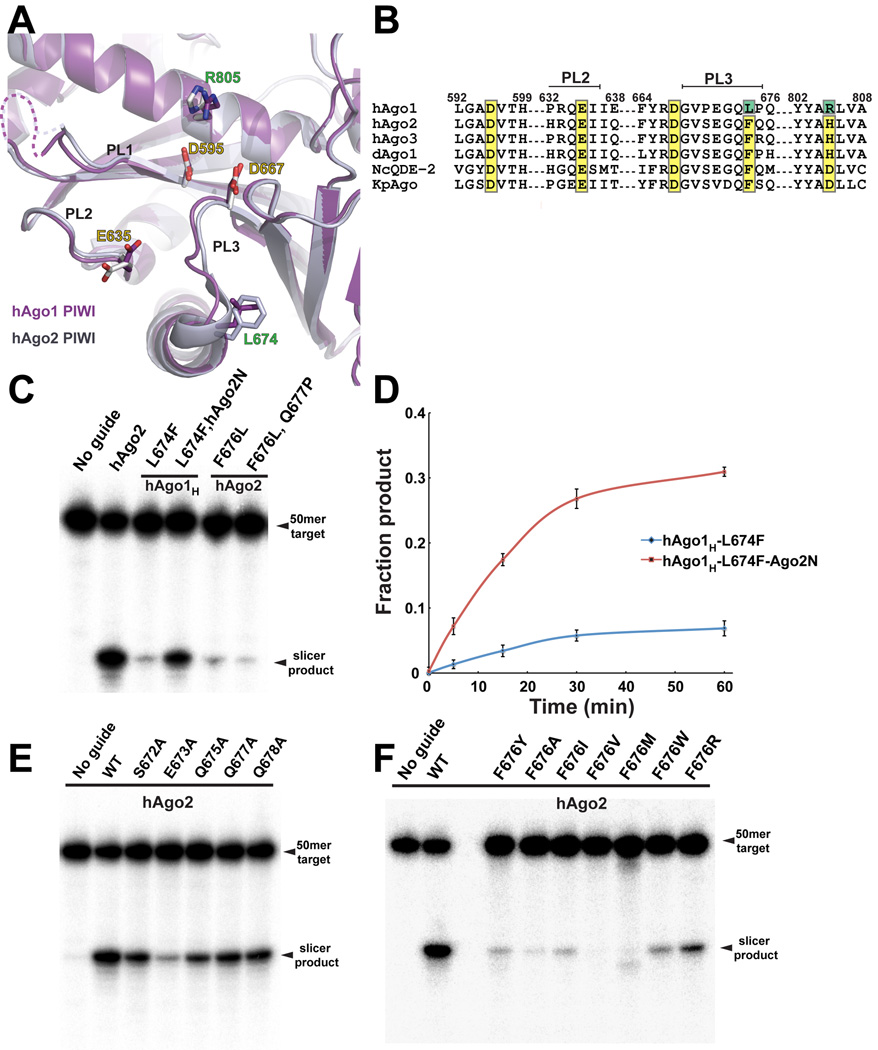
Figure 3. Two Mutations in the PIWI Domain Activate hAgo1.
(A) View of the superimposed active sites in the PIWI domain of hAgo1 and hAgo2. The PIWI domain of hAgo1 is colored purple and hAgo2 is grey. Conserved active site residues are labeled with yellow text. Mutations in hAgo1 that activate slicing are labeled in green. The PIWI domain loops (PL1, PL2 and PL3) that cluster near the active site are indicated. (B) Sequence alignment focused on the catalytic tetrad residues for hAgo1, hAgo2, hAgo3, Drosophila Ago1 and Ago2 (dAgo1 and dAgo2), and two other eukaryotic Argonautes for which structures are known, NcQDE-2 and KpAgo. Conserved catalytic residues are highlighted in yellow and mutations that activate hAgo1 are highlighted in green. The PIWI domain loops PL2 and PL3 are indicated. (C) Slicer assay showing activated hAgo1H by mutation of L674F. The N domain of hAgo2 enhances the slicing by the activated hAgo1. F676L mutants of hAgo2 have a severe defect in slicing. (D) Plot of fraction product cleaved over a 60–minute time course showing the activated hAgo1H L674F and the enhancement from the hAgo2 N domain. The standard error deviation from the mean of three individual replicates is plotted with data points connected by a smooth curve in Excel. (E) Mutants of the PL3 loop residues in hAgo2 show that E673 is important for slicing. (F) Mutants of F676 in hAgo2 greatly impact slicing activity. Slicer assays shown in panels C, E and F are representatives of at least three individual replicates. See also Figure S3.

