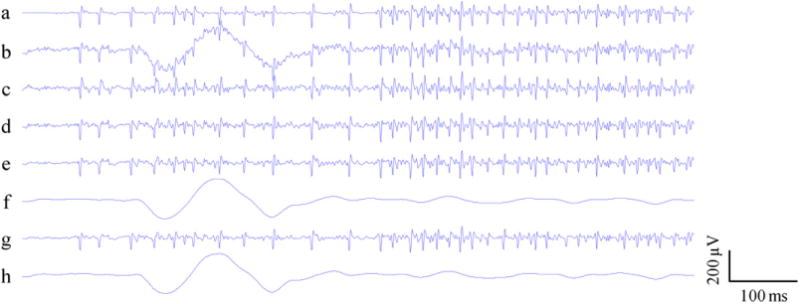
Fig. 4.

An example of reducing BW from surface EMG using different methods. From top to bottom: (a) the original highly clean surface EMG signal (denoted as EMG2); (b) the surface EMG signal contaminated by BW noise; (c) the output of the IIR causal filter; (d) the output of the IIR noncausal filter; (e) the output signal after EMD filtering; (f) the estimated BW noise after EMD filtering; (g) the output signal after EEMD filtering; and (h) the estimated BW noise after EEMD filtering.
