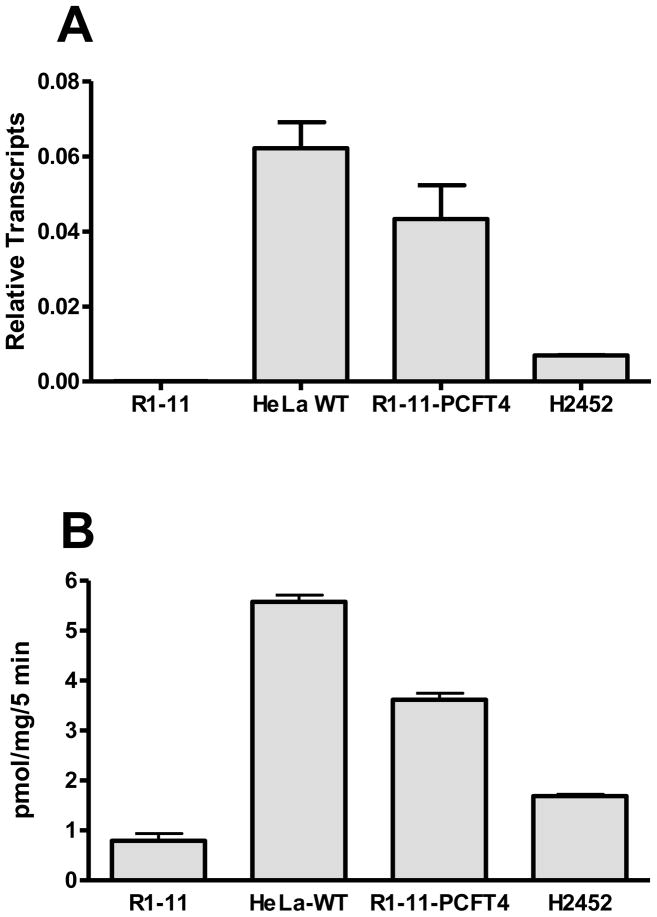
Figure 2. hPCFT expression in human solid tumor cell lines.
Panel A: Results are shown for real-time RT-PCR analysis of hPCFT transcripts in R1-11, HeLa wild-type (WT), R1-11-PCFT4 and H2452 cells, normalized to levels of GAPDH transcripts. Panel B: Transport was measured in R1-11, HeLa wild-type, R1-11-PCFT4, and H2452 cells over 5 minutes at 37°C with [3H]Mtx at 0.5 μM in pH 5.5 buffer. Internalized [3H]Mtx was normalized to total cell proteins and results are expressed as pmol/mg cell protein. Results are presented as mean values plus/minus ranges from 2–3 experiments.

