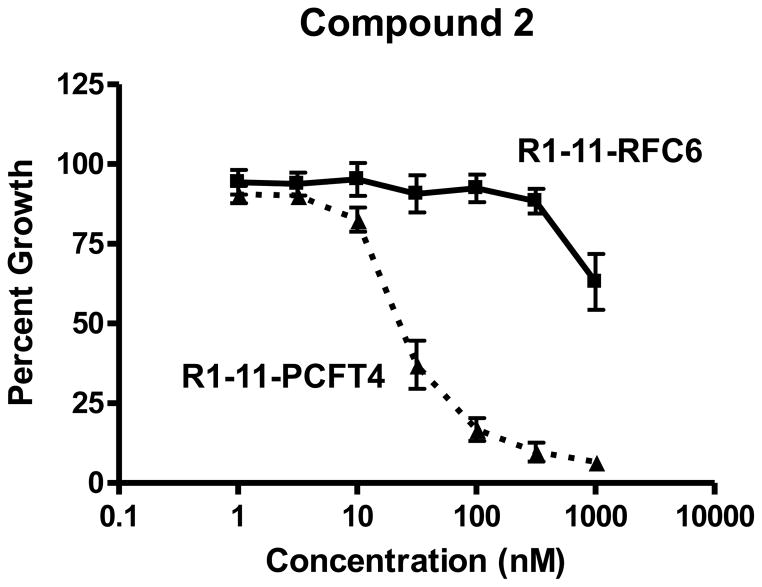
Figure 3. Characterization of growth inhibition by compound 2.
Growth inhibition curves for R1-11-PCFT4 and -RFC6 cells treated continuously with compound 2 are shown. Cells were plated (5000 cells/well) in folate-free RPMI 1640 medium with 10% dialyzed serum, antibiotics, L-glutamine, and 25 nM LCV. Relative cell numbers were quantitated after 96 h as described in Materials and Methods. IC50 values (as mean values ± SEM) were 28.2 (± 7) nM for R1-11-PCFT4 and 989(± 11) nM for R1-11-RFC6 cells (n=3).

