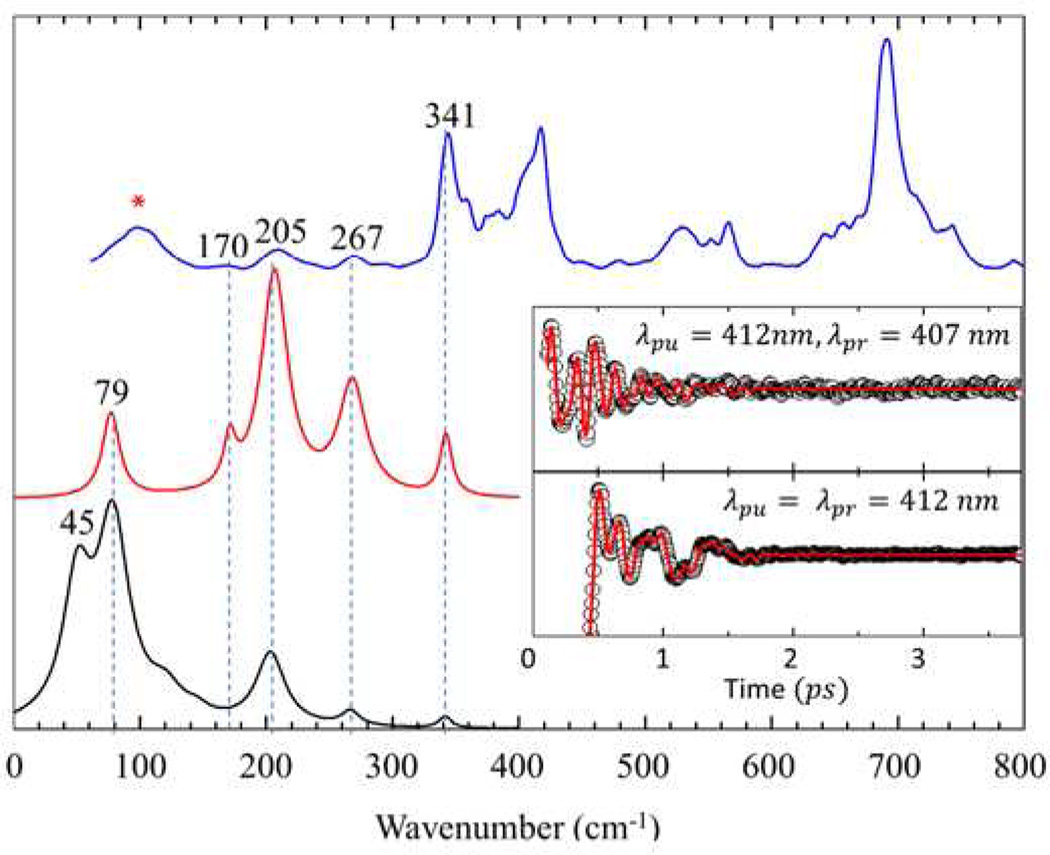
Figure 2.
Correlations between Raman and coherence spectra for unfolded ferric cyt c with 4M GdHCl at pH 7.0. The Raman spectrum (blue) was measured with excitation at 413.1 nm, whereas the open band (black) and detuned (red) coherence spectra (displaced below the Raman spectrum) were measured at a carrier wavelength of 412 nm. The detuned coherence data were collected with a 0.5 nm spectral window, detuned 5 nm to the blue of the carrier wavelength. The insets show the time domain VCS data (circles) for the detuned (upper) and open band (lower) conditions. The LPSVD fits are shown as red lines in the inserts. The Raman peak marked with “*” corresponds to a GdHCl peak.

