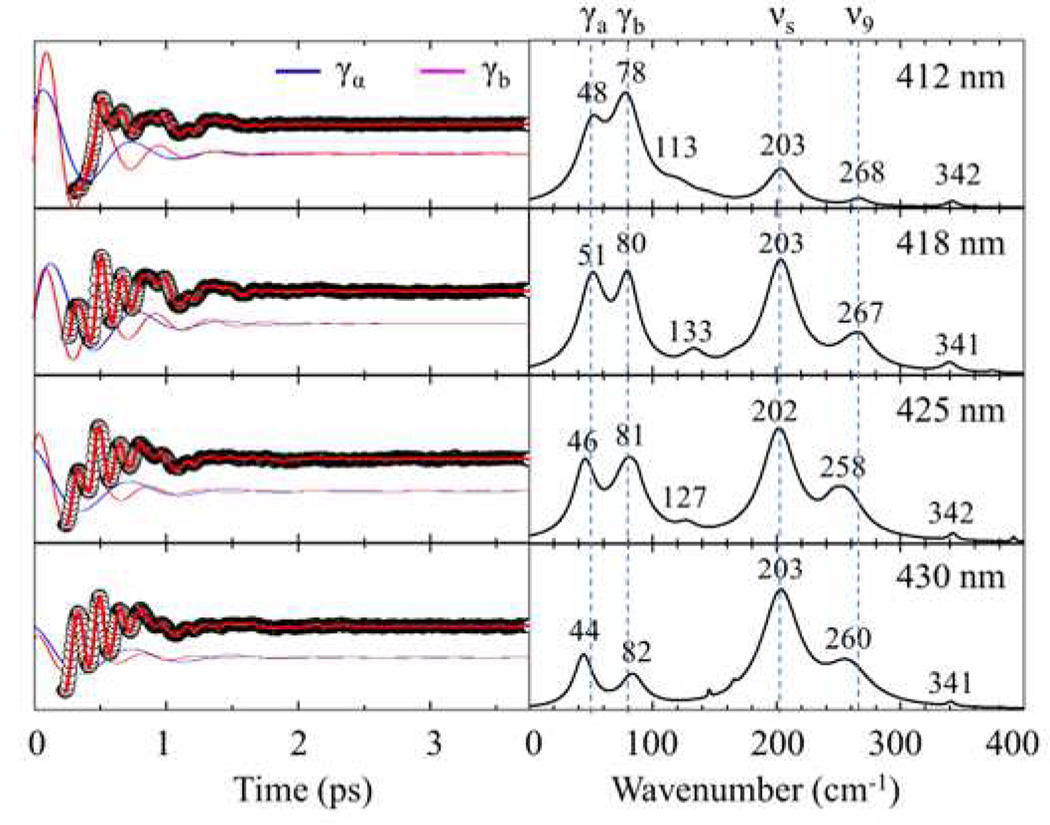
Figure 5.
Open band VCS spectra of unfolded ferric cyt c (at 4 M GdHCl) measured with 70 fs laser pulses at 412 nm, 418 nm, 425 nm and 430 nm. The left panel displays the oscillatory components (black circles) and LPSVD fits (red lines). The blue and magenta oscillations represent the fits to the individual ~50 cm−1 (γa) and ~80 cm−1 (γb) modes and are shifted for clarity. The right panel shows the amplitudes of the corresponding power spectra. The phases and damping times of these modes are given in Table 2.

