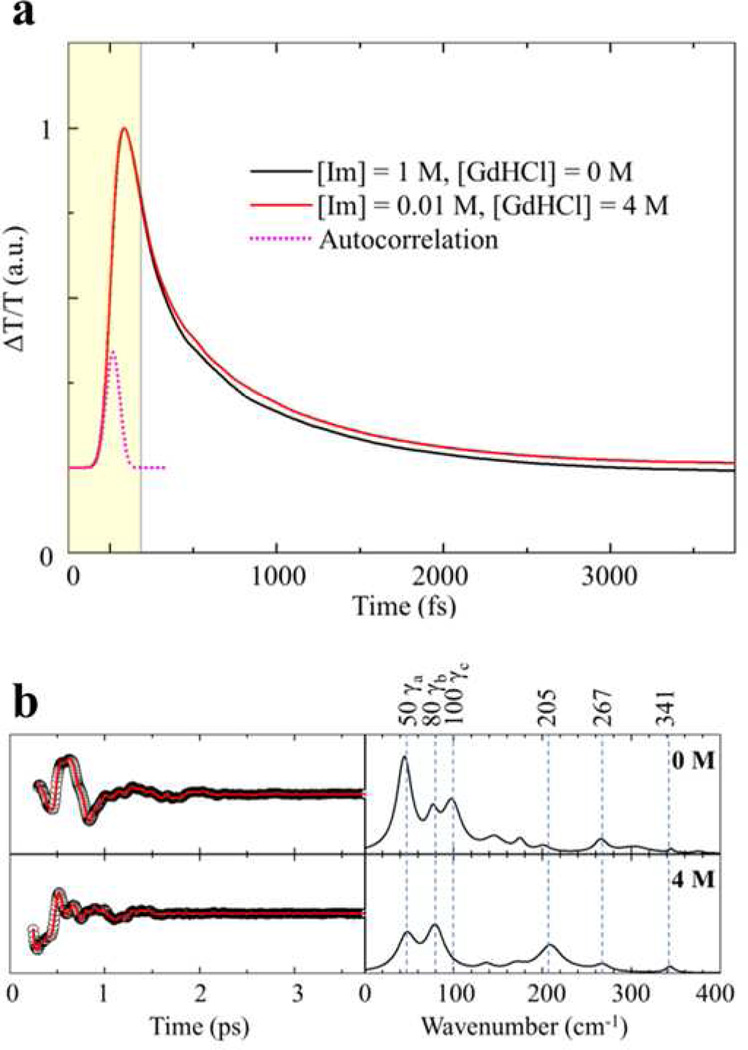
Figure 6.
(a) Open band optical responses for the folded and unfolded ferric cyt c-imidazole complex. Both traces were normalized at the peak of the coherence spike and the data within shaded window were truncated and were not included in the LPSVD fitting procedure. (b) VCS signals and power spectrum amplitudes for the same samples as shown in panel (a). The left panel displays the oscillatory components (black circles) and the LPSVD fits (red lines). The right panel shows the corresponding power spectrum amplitudes. The amplitudes of the power spectra are normalized using the kinetic traces shown in panel (a).

