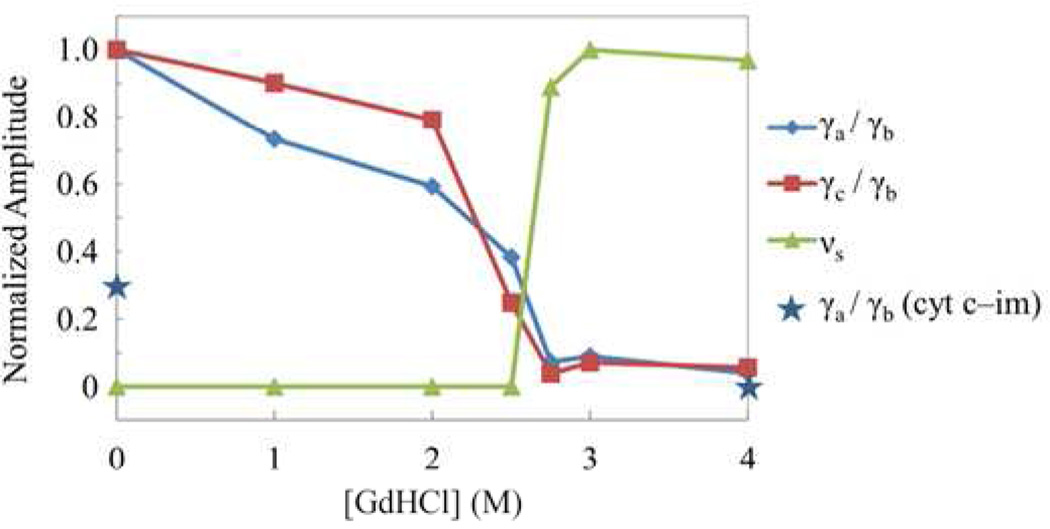
Figure 7.
Plot of the relative amplitude changes for the unfolding-sensitive low-frequency modes of native cyt c as a function of GdHCl concentration. The amplitude ratios with respect to γb, which is relatively insensitive to unfolding, are plotted. The relative change is normalized to unity at the maximum value for each mode.

