
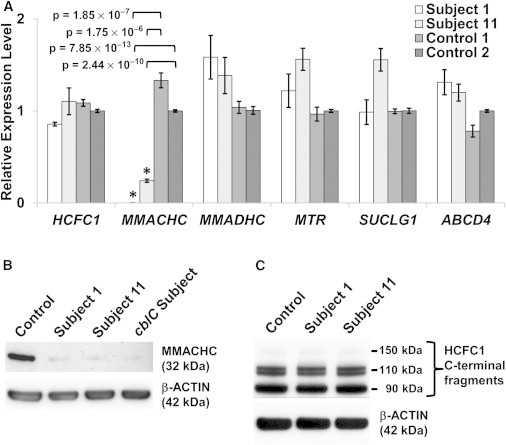
Figure 3.
Expression Analysis
(A) qPCR analysis of mRNA expression. MMACHC expression was either completely lost or reduced by ∼76% in fibroblasts derived from subjects 1 and 11, respectively (asterisks indicate statistical significance). Error bars represent the SEM of relative expression levels. The two control samples used were from healthy individuals with no known biochemical or neurological phenotypes.
(B) Immunoblot analysis of MMACHC. Fibroblast lysates from a reference (control) sample (human dermal fibroblast C-013-5C, Life Technologies), two individuals with cblX, and one with cblC were analyzed. The cblX (lanes 2 and 3) and cblC (lane 4) lines show only trace amounts of MMACHC (top panel).
(C) Immunoblot analysis of HCFC1. Fibroblast lysates from the same control used in (B) and two cblX cell lines were analyzed. HCFC1 levels in all the samples remained unchanged. β-actin was used as a loading control in all immunoblots (in the bottom of B and C).