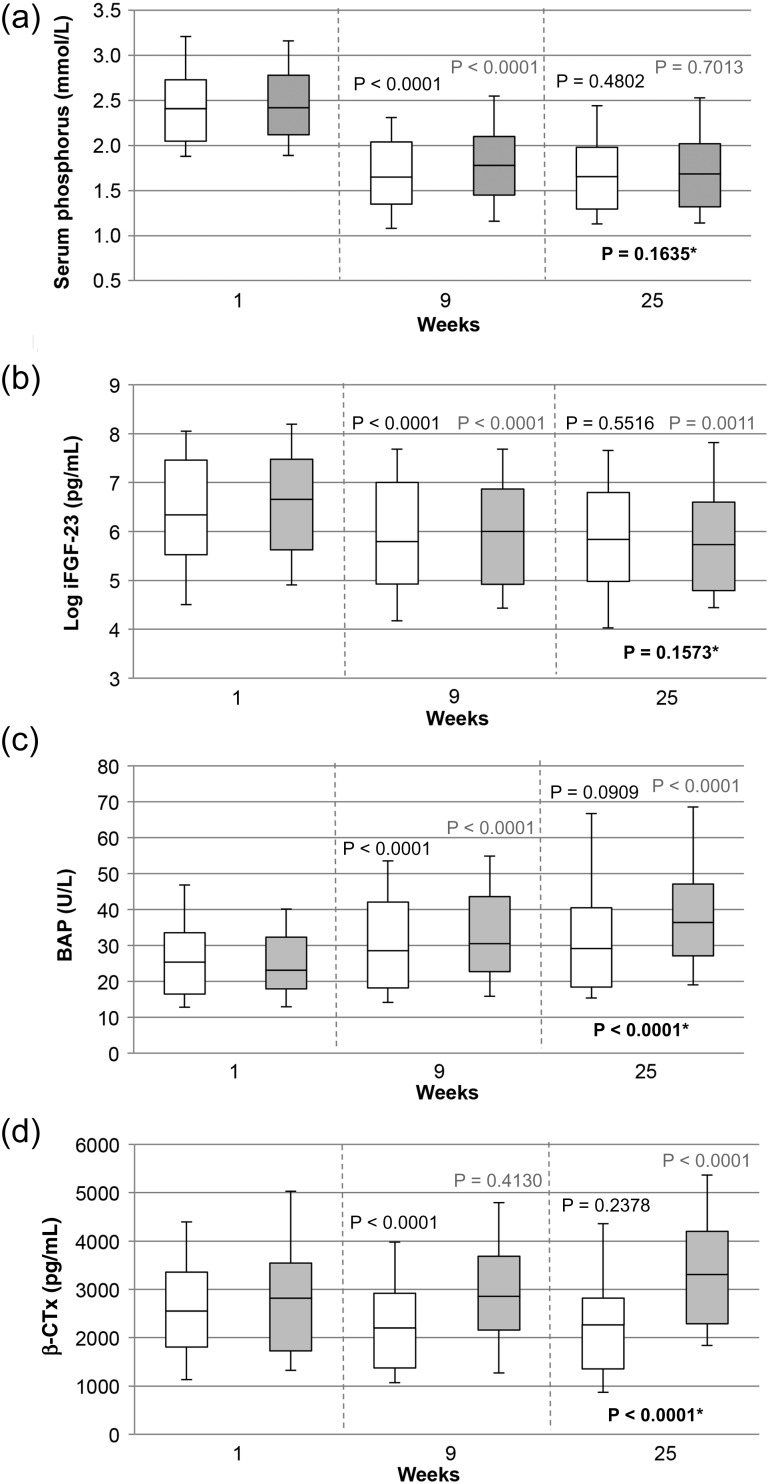
FIGURE 1:
View of selected parameters from Tables 2 and 3 to illustrate the impact of phosphate binders on serum levels of (a) phosphorus, (b) log-intact FGF-23, (c) bone AP and (d) beta-crosslaps. Time course of values at Weeks 9 and 25 of the calcium acetate/magnesium carbonate group (n = 105) and of the sevelamer-HCl group (n = 99) (PPS) is displayed in white and grey, respectively. Probability values are the result of the Wilcoxon test for within-group significance (Week 9 versus Week 1 and Week 25 versus Week 9, respectively) and repeated measures ANCOVA for between-group evaluation (indicated by asterisks). The plotted values indicate medians and interquartile range, with 10th and 90th percentiles as the error bars.

