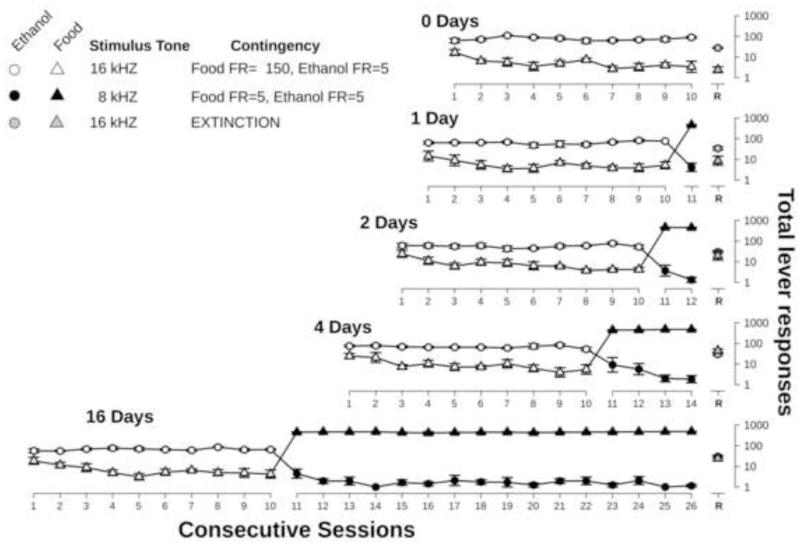
Figure 2.
Total responses for ethanol (circles) and food (triangles) during each phase of the experiment. Points represent mean ± S.E.M. for 5 rats plotted on a log scale. White symbols represent exposure to only the 16 kHz tone and FR150 response requirement for food and FR5 for ethanol over ten consecutive sessions. Black symbols represent various periods of exposure to the 8 kHz tone and matched FR5 response requirements for food and ethanol. Grey symbols represent responses during test sessions following each period of exposure to matched (FR5) response requirements for food and ethanol.

