
Figure 3.
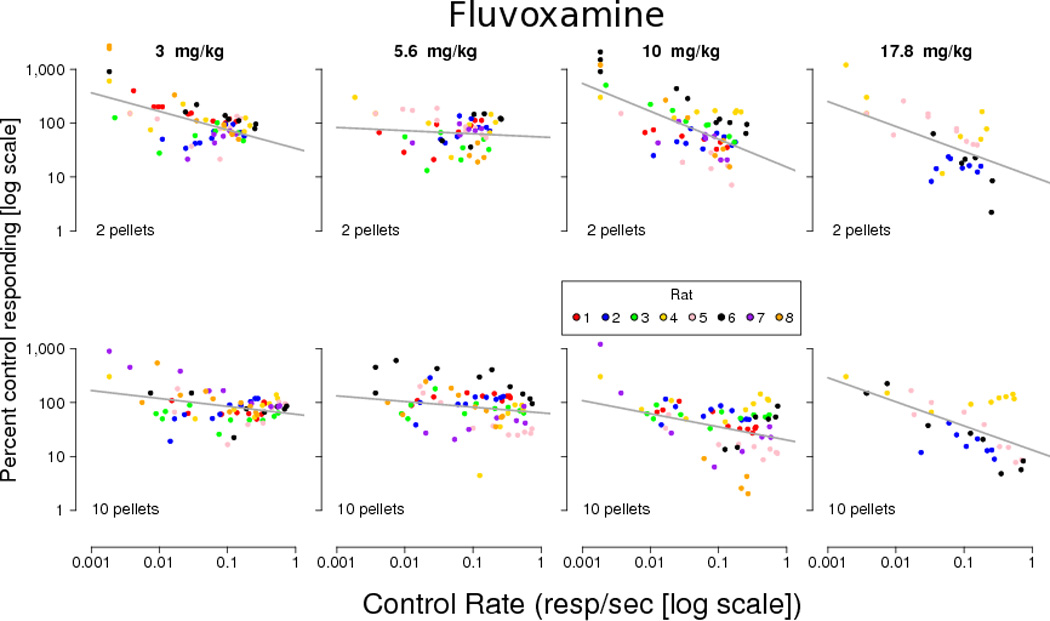
Effects of fluvoxamine on responding (as a percentage of the local control rate) for 2-pellets (upper panels) or 10-pellets (lower panels) expressed as a function of control rate. Control rate and drug rates (expressed as drug rate/control rate × 100) are log transformed. Each subject is represented by a different color. Control rates and drug effects equal to zero resp/sec were excluded from the plot and analysis. The line represents the linear mixed-effects regression for each panel.