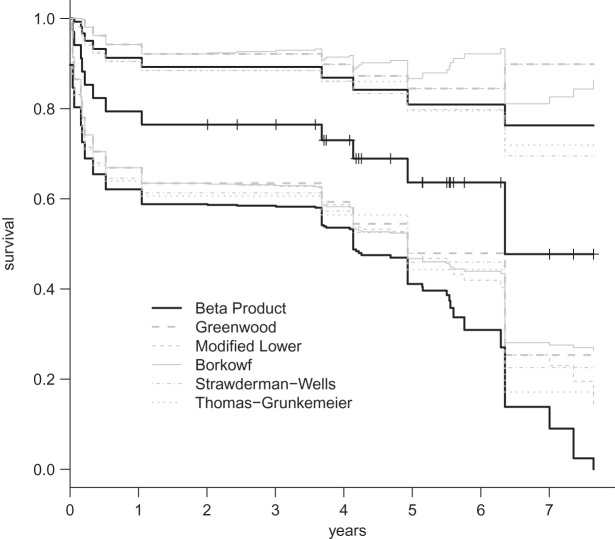
Fig. 1.
The black middle curve is the Kaplan–Meier estimator of survival for 34 patients with 12 observed deaths from Nash and others (2007). Censored values are denoted by small vertical hashes. Gray lines are previously derived CIs and the black CIs are the BPCP intervals developed in this paper.

