
Figure 2.
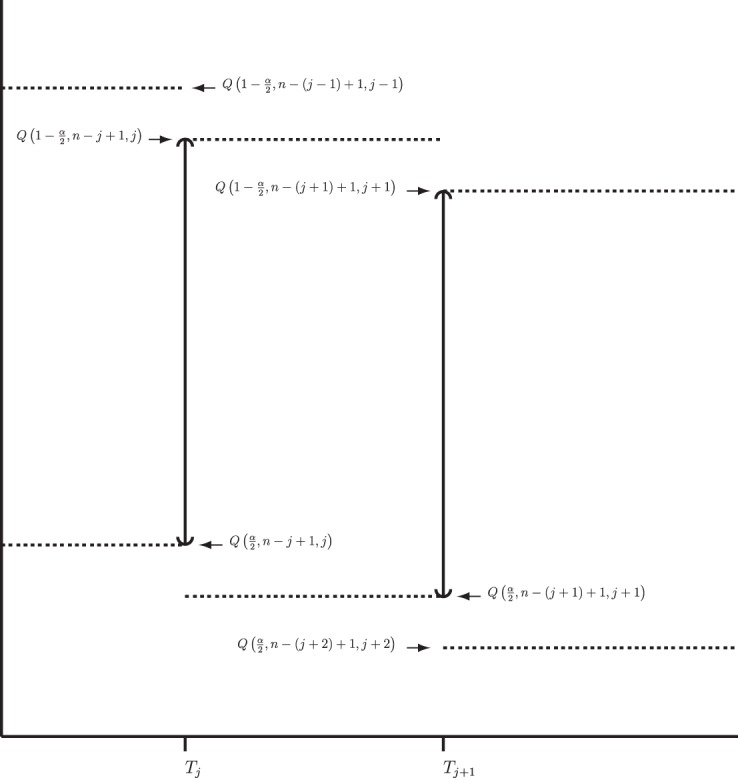
BPCP without censoring. Recall that  . Note that the upper limits use the
  th quantile of
  in
in  , while the lower limits use the
  th quantile of
  in
in  . For any
  the CI is equivalent to the Clopper–Pearson interval for
  successes out of n trials with probability
  .
.