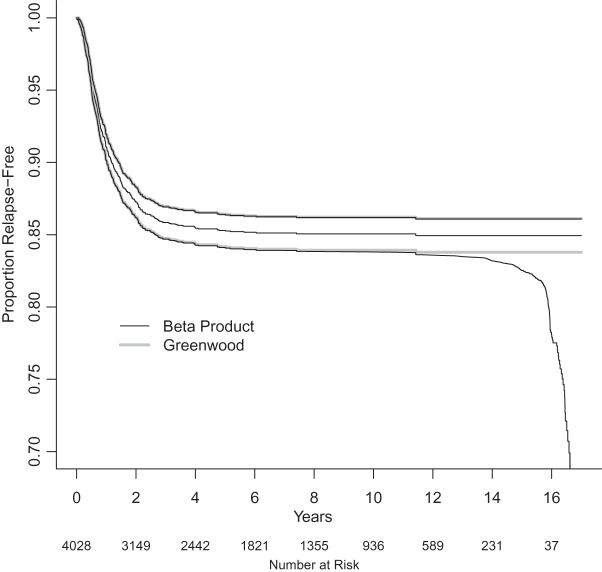
Figure 3.
National Wilms Tumor Study Group, third and fourth clinical trials (Breslow and Chatterjee, 1999). The black middle curve is the Kaplan–Meier estimator for time to relapse for the  children included in the dataset in the R survival package (Therneau, 2012). Thick gray lines are standard CIs (Greenwood variance using log transformation) and the black CIs are the BPCP intervals.

