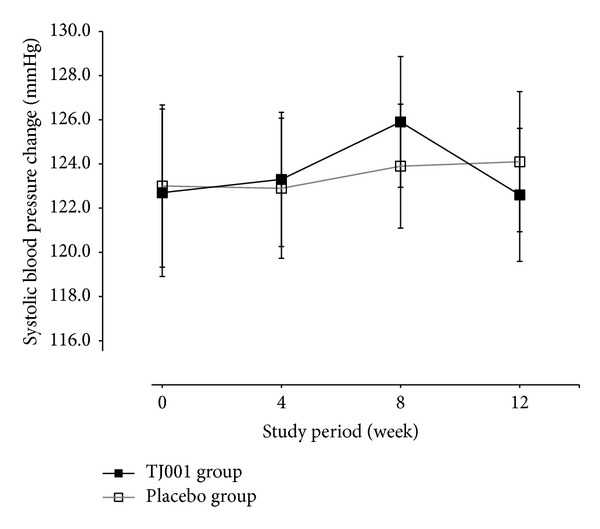
Figure 4.

Changes in average systolic blood pressure (SBP) over time. Data are shown as mean ± S.D. of SBP at each week. Full squares with a solid line indicate the herbal treatment (TJ001) group, and empty squares with a grey line depict the placebo group. No statistically significant differences were found between groups at each week.
