
Figure 2.
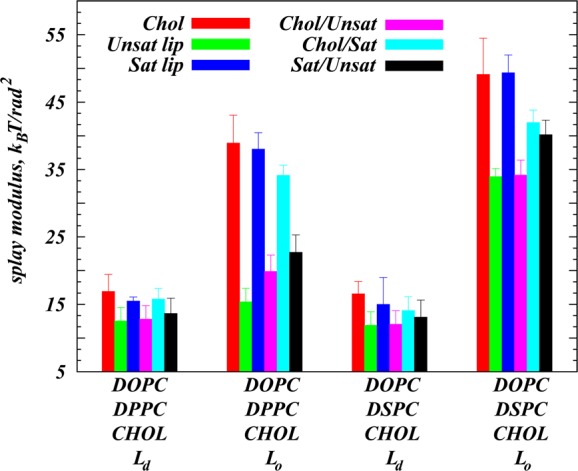
Splay modulii χ12 for all the possible molecular pairings derived from Martini simulations of DOPC/DPPC/Chol and DOPC/DSPC/Chol mixtures in the Ld and Lo phases (MS simulation set in Table 1). The data for different pairs are shown in the following colors: Chol/Chol in red, DOPC/DOPC in green, pairs of saturated lipids (either DPPC or DSPC in the respective systems) in blue, Chol/DOPC in purple, pairs of Chol and saturated lipid in cyan, and the DOPC with saturated lipid pair in black. Error bars represent the standard deviations obtained from fits (see Figure 1) performed in different angular intervals and on different trajectory segments (see Supporting Material for more details).