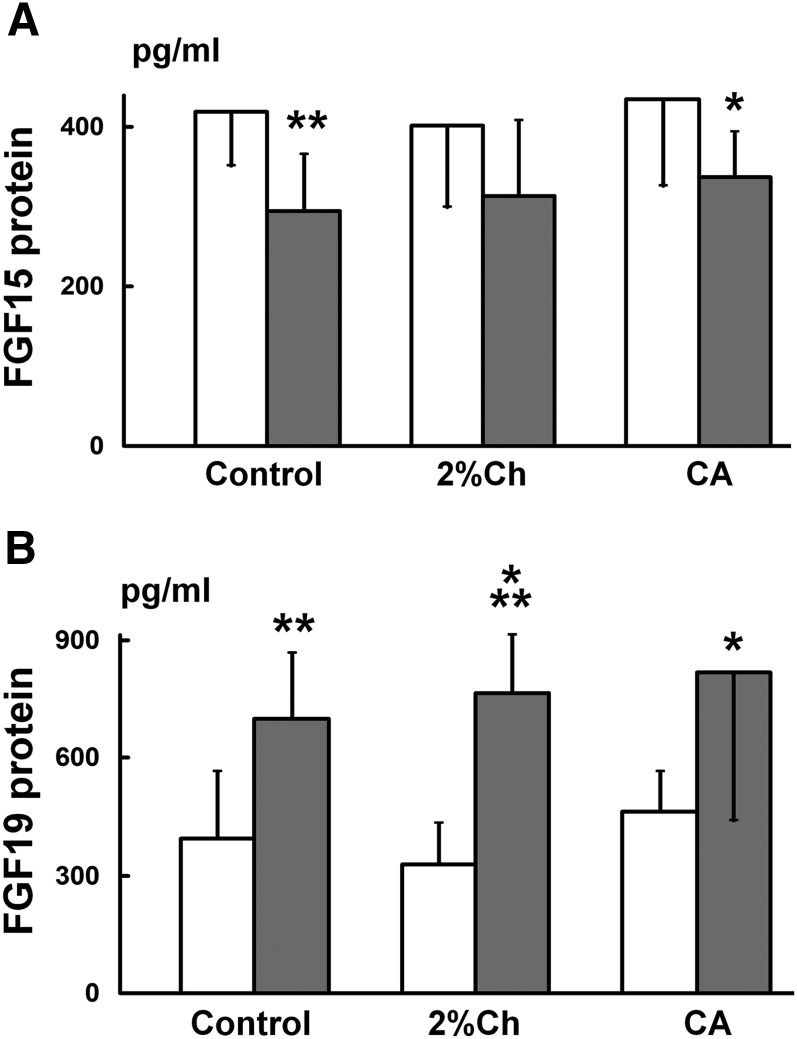
Fig. 5.
Comparison of FGF15/19 protein concentrations in the portal and peripheral blood. A: FGF15 protein levels in the rat study. Rats were fed with regular chow (Control), 1% CA, or 2% Ch for 7 days. Data (n = 8) are represented as mean ± SD. *P < 0.05 and **P < 0.01 when compared with that in the portal blood using the t-test. The open bar represents FGF15 levels in the portal blood while the gray bar represents FGF15 levels in the peripheral blood. B: FGF19 protein levels in the rabbit study. Rabbits were fed with regular chow (Control), 0.3% CA, or 2% Ch for 7 days. Data (n = 8) are represented as mean ± SD. *P < 0.05, **P < 0.01, and ***P < 0.001 when compared with that in the portal blood using the t-test. The open bar represents FGF19 levels in the portal blood while the gray bar represents FGF19 levels in the peripheral blood.

