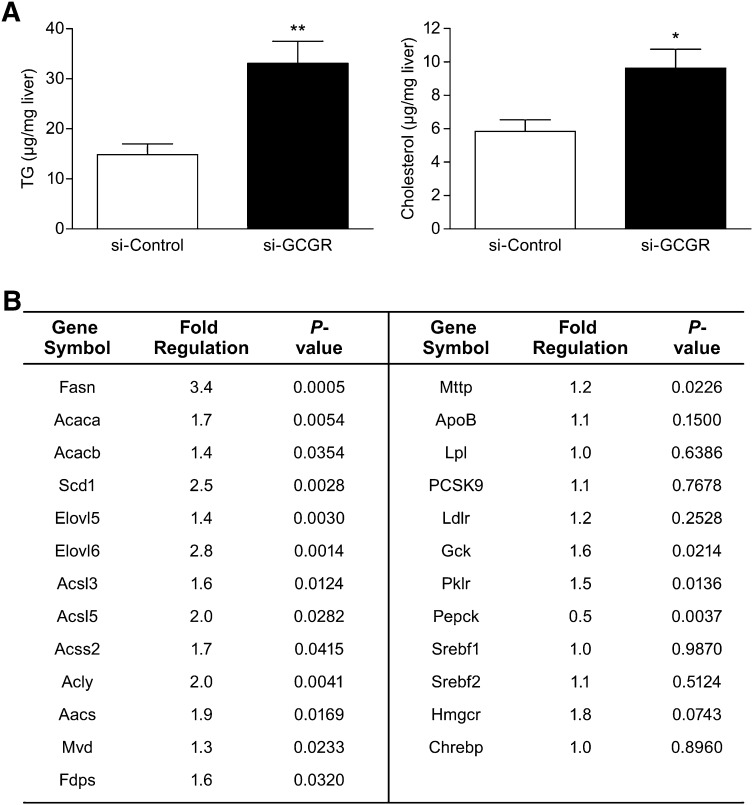
Fig. 3.
Hepatic lipid content and mRNA expression of genes involved in lipid metabolism. A: Hepatic TG and cholesterol levels in the livers of si-Control and si-GCGR mice. Data are shown as the mean ± SEM (n = 8). The statistical significance of the differences was determined by Student's t-test, and a P value <0.05 was considered significant (*P < 0.05; **<0.01 vs. si-Control). B: Analysis of hepatic gene expression by real-time quantitative PCR in si-Control and si-GCGR mice (n = 8). Fold regulation indicates the ratio of expression levels in si-GCGR over si-Control. Livers were collected from mice in the fed condition. The statistical significance of the differences was determined by Student's t-test, and a P value <0.05 was considered significant.

