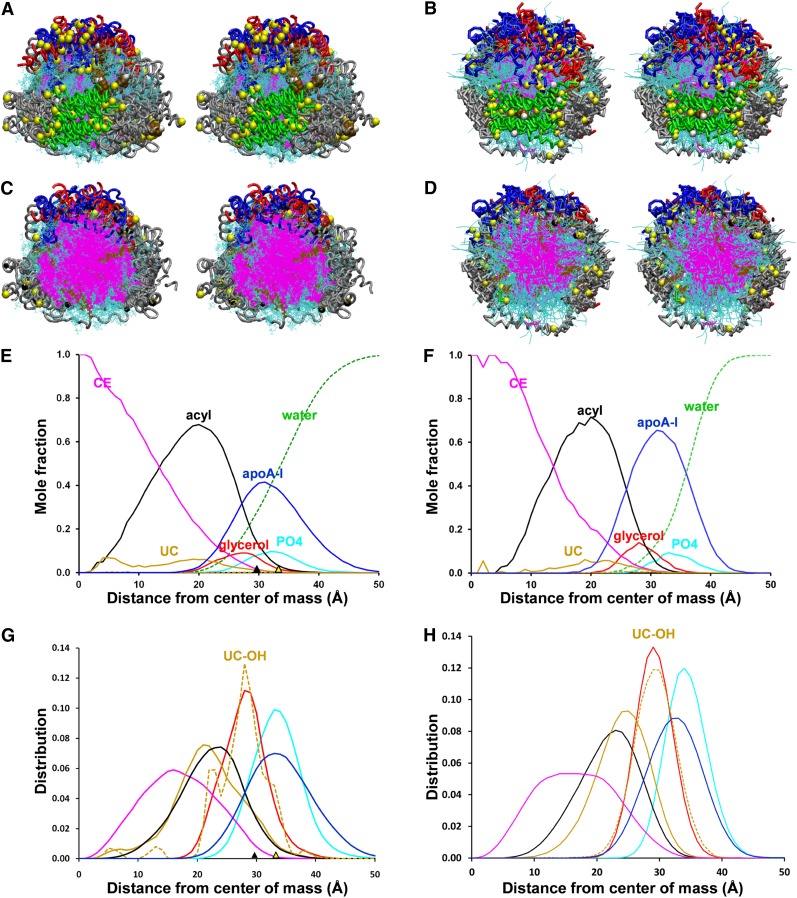
Fig. 1.
Properties of aligned ensembles of S2-57 sHDL particles formed after AA and CG simulations. The protein chains were aligned between residues 78 and 188, the domain containing the interhelical, less solvent-accessible salt bridges. A, B. Cross-eyed stereo views from helix 5 side (green) of AA and CG ensembles, respectively. The protein is in licorice ribbon representation: prolines, yellow space filling; helix 5, green; helix 10, red; residues 1–43, blue; remainder of protein, silver; CE, magenta lines; POPC, cyan lines; UC, brown space filling; UC-OH, white space filling. C, D. Cross-eyed stereo views of cross-sections of aligned AA and CG ensembles, respectively. Graphic representation is the same as (A, B) except UC is in line format. E, F. Plots of radial mole fractions of components of MDSA and CGMD simulations, respectively, averaged over the last 20% of their trajectories. G, H. Plots of radial distributions of components of MDSA and CGMD, respectively, averaged over the last 20% of their trajectories. CE, magenta; UC, gold; POPC acyl chains, black; UC-OH, dashed gold; glycerol moiety of POPC, red; apoA-I, blue; POPC headgroups, cyan; solvent, dashed green. The black triangles on the x axis represent the mean radius of gyration; the yellow triangles on the x axis represent the radius calculated from molecular volumes of the individual components.

