
Fig. 1.
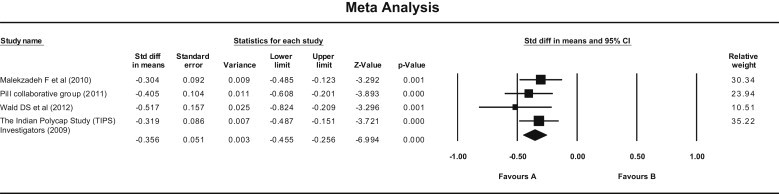
Forest plot showing effect of Pollypill on systolic blood pressure (Fixed effect model). Standard mean difference = −0.356 (95% CI −0.455 to −0.256), Z = −6.993, P = 0.00). (Q = 1.77, df = 3, P = 0.62, and I Square = 0).
Official websites use .gov
A
.gov website belongs to an official
government organization in the United States.
Secure .gov websites use HTTPS
A lock (
) or https:// means you've safely
connected to the .gov website. Share sensitive
information only on official, secure websites.
Forest plot showing effect of Pollypill on systolic blood pressure (Fixed effect model). Standard mean difference = −0.356 (95% CI −0.455 to −0.256), Z = −6.993, P = 0.00). (Q = 1.77, df = 3, P = 0.62, and I Square = 0).