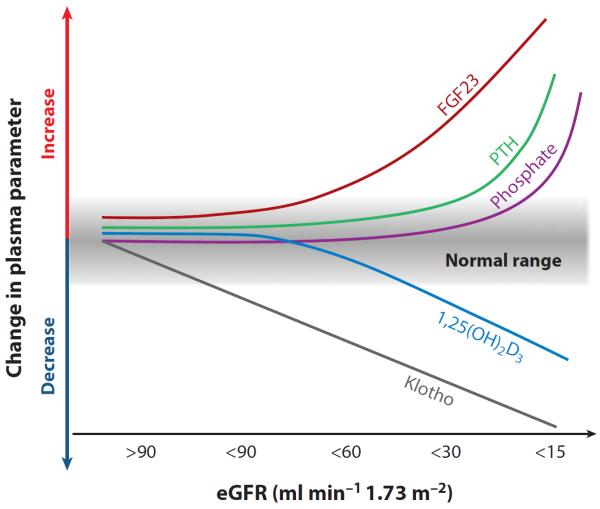
Figure 5.
Proposed time profile of changes in blood phosphate (Pi), calcium, Klotho, and hormones relevant to mineral metabolism in chronic kidney disease (CKD). The decrease in Klotho protein in the kidney and blood is an early event in CKD and is sustainably and progressively reduced along with the decline of renal function. Low Klotho partially induces fibroblast growth factor (FGF) 23 resistance, causing an initial compensatory increase in blood FGF23 to maintain Pi homeostasis. Increase in FGF23 decreases vitamin D levels and is followed by elevation of parathyroid hormone (PTH). Hyperphosphatemia is a relatively late event in advanced CKD; normal range is shown in gray. The scale is not meant to be truly proportionate; e.g., the elevation of FGF23 is massive in CKD compared with the elevation of parathyroid hormone. The x axis represents decline in renal function from stage 1 to 5 of CKD based on estimated glomerular filtration rate (eGFR).

