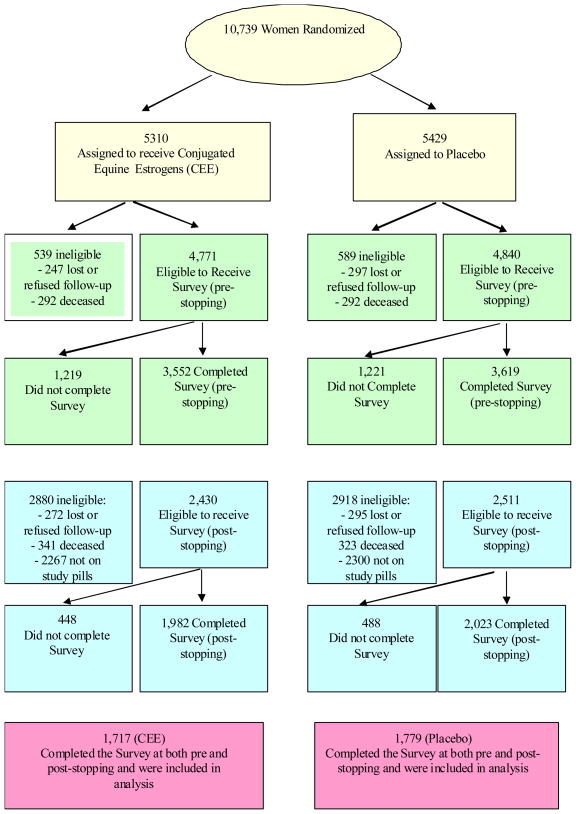
Fig. 1.
Profile of CEE Hormone Symptom Survey Respondents Pre-stopping and Post-stopping. Yellow depicts Screening and Baseline for the full cohort. Green presents subset of women receiving the pre-stopping survey. Blue presents subset of women who were still taking study pills March 2004 and received a post-stopping survey. Pink presents the N of women who completed the pre and post-stopping Estrogen-Only surveys.

