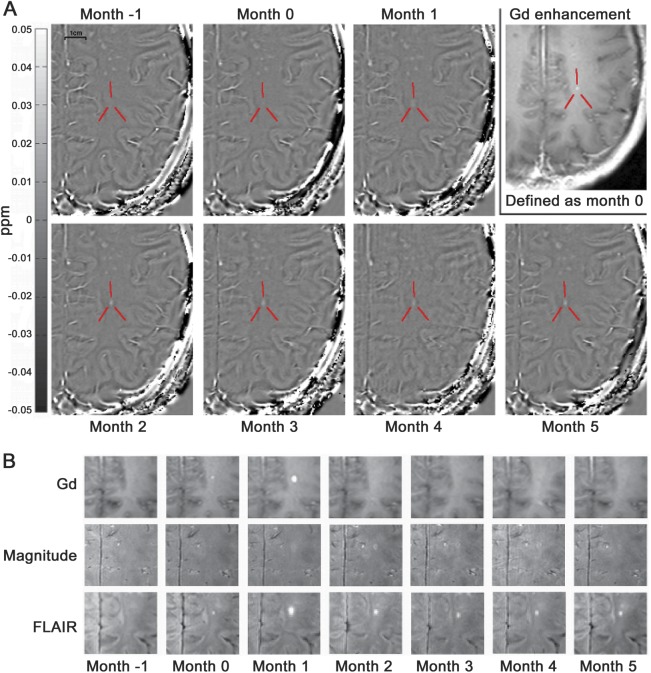
Figure 2. Serial MRI of an MS lesion using frequency shift mapping and conventional MRI.
(A) Frequency shift maps of an enhancing lesion (indicated by red lines) between 1 month before enhancement (month −1) and 5 months after enhancement (month 5), as well as the Gd-enhancing scan, which defines scan 1 as month 0 for this particular lesion. The lesion was barely visible at months −1 and 0 and became increasingly hyperintense during the months after Gd enhancement. (B) Gd-enhanced scan, with the magnitude corresponding to the phase/frequency and the FLAIR images at all months. Note that in this case, the strongest enhancement occurred at month 1. The scale bar in panel A corresponds to 1 cm. FLAIR = fluid-attenuated inversion recovery; Gd = gadolinium; MS = multiple sclerosis.

