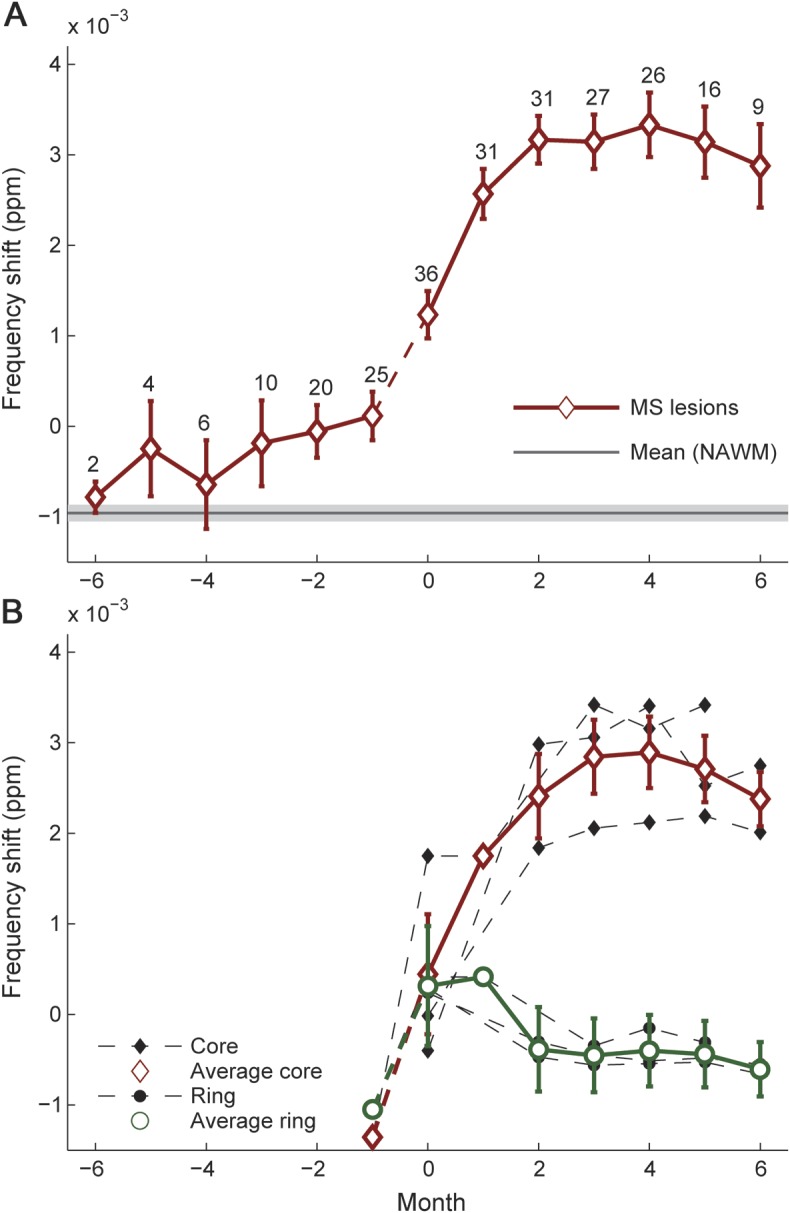
Figure 3. Frequency changes over time averaged over all 40 MS lesions, including ring-enhancing lesions.

(A) Frequency shifts within Gd-enhancing MS lesions over time (average over 40 lesions, diamonds). The error bars indicate the SEM and the numbers at each time point are the number of lesions contributing to the respective data. Note that not all lesions were captured with frequency mapping at every month. For instance, 36 instead of 40 lesions contribute to month 0. The gray line and light gray shaded line indicate mean frequency shift and average standard error in NAWM, respectively. There is a pronounced increase in MR frequency during the 2 months around Gd enhancement. Because the events during the month before Gd enhancement may be rather abrupt and nonlinear, a dashed line was used for this time period. Significant differences between MS lesions and NAWM were found beginning 3 months before the lesion appears and for all subsequent months. The frequency shifts showed a significant positive slope between months −1 and 2 (p < 0.0001) and no significant slopes between months −6 and −1 and months 2 and 6. Month 0 and all subsequent months were significantly different from all time points before lesion onset. (B) Ring-enhancing lesions. The enhancing ring and the core of 3 ring-enhancing lesions were investigated separately. Whereas the cores exhibited a distinct frequency shift similar to focally enhancing lesions, no such evolution was observed for the enhancing ring. Note that the cores of the 3 ring-enhancing lesions were included in the average shown in panel A. Gd = gadolinium; MR = magnetic resonance; MS = multiple sclerosis; NAWM = normal-appearing white matter.
