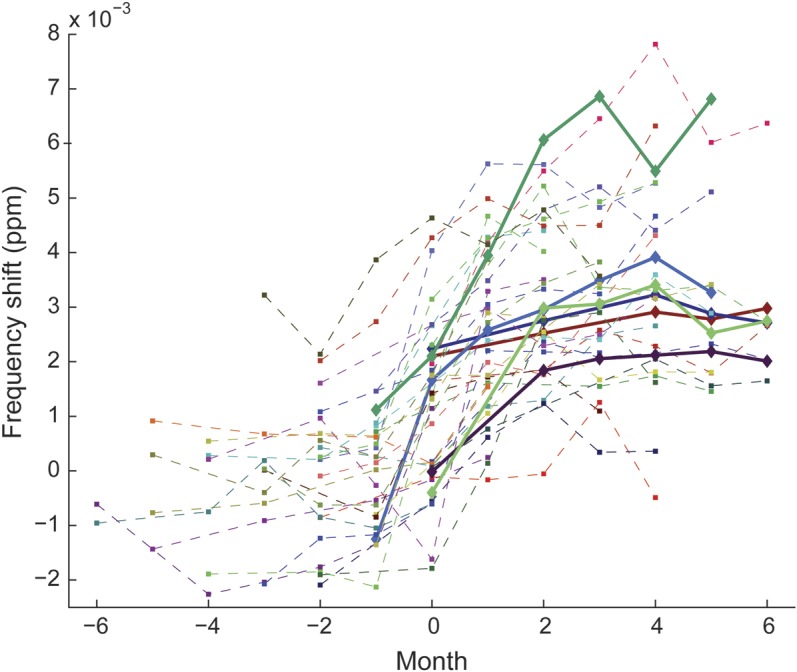
Figure 4. Condensed plot showing the temporal evolution of all enhancing multiple sclerosis lesions.

All lesions (focal and core of ring-enhancing lesions) contributing to the average in figure 3A are displayed. There is variability in frequency shifts between lesions. Note that some lesions reached frequency shift values up to 7 × 10⁻³ ppm, which is higher than the observed offset in cortical gray matter (figure 1A). Solid lines represent newly enhancing lesions that showed T1 hypointensity after 5 to 6 months.
