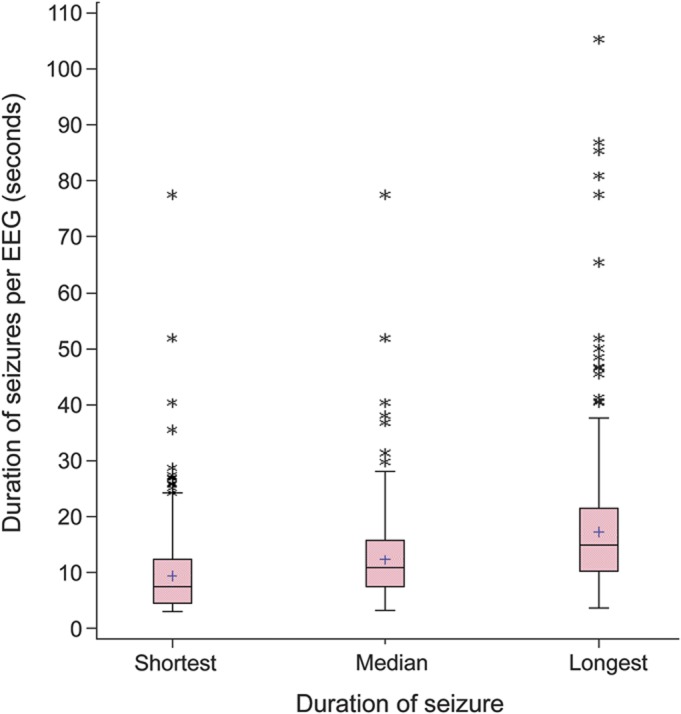
Figure 2. Pretreatment seizure duration (n = 440).

Box-and-whisker plots of seizure duration on pretreatment EEG are shown. The boundaries of the boxes are the 25th percentile and 75th percentile of the distributions of the shortest, median, and longest seizure duration per patient. The line within the box reflects the median of these durations and the “+” symbol reflects the mean. The whiskers extend 1.5 times the length of the box from the median to the applicable percentile (25th or 75th), beginning from the 25th or 75th percentile. The asterisks represent outliers that are beyond the end of the whiskers as defined here.
