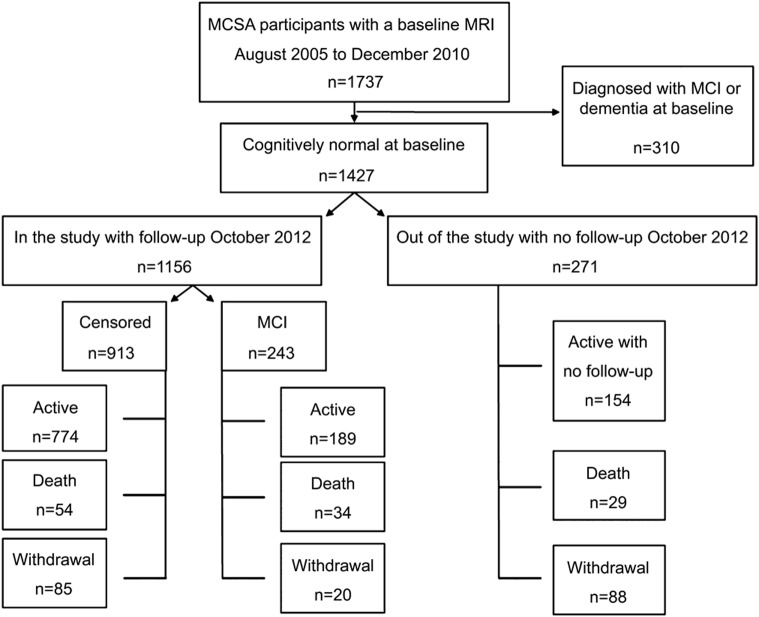
Figure 1. Flow diagram of the study population by October 2012.
We followed 1,156 subjects and observed 243 events (21%). Of the remaining 913 “nonevents,” 657 of 1,156 (57%) were censored in that by October 2012 they were not known to be dead and not more than 3 months overdue for their next scheduled follow-up visit. The remaining 256 of 1,156 (22%) were considered dropouts in that they died before follow-up (70/1,156, 6%) or were more than 3 months overdue for their visit (186/1,156, 16%). MCI = mild cognitive impairment; MCSA = Mayo Clinic Study of Aging.

