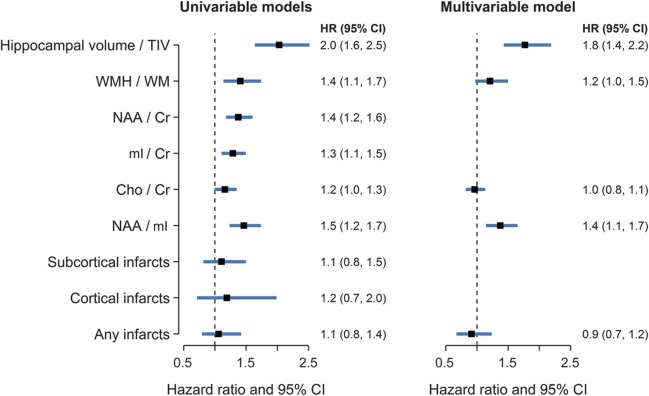
Figure 2. Hazard ratio estimates and 95% confidence intervals from univariable (A) and multivariable (B) Cox proportional hazards models.
Hazard ratios for continuous predictors represent an interquartile difference (HRIQR, described in the Methods section) to aid interpretation and facilitate comparisons across variables. Cho = choline; CI = confidence interval; Cr = creatine; mI = myo-inositol; NAA = N-acetylaspartate; TIV = total intracranial volume; WM = white matter; WMH = white matter hyperintensity volume.

