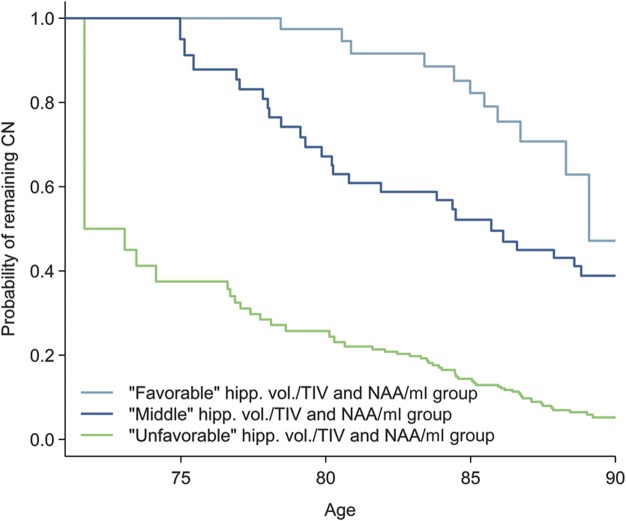
Figure 3. Survival curves based on tertile groups for hippocampal volume/TIV and NAA/mI.
Curves illustrate the estimated probability of remaining cognitively normal (CN), assuming normal cognition at age 70 years. The light blue line corresponds to subjects in the favorable or higher hippocampal volume/TIV and NAA/mI. The dark blue line corresponds to subjects in the middle hippocampal volume/TIV and NAA/mI. The light green line corresponds to subjects in the unfavorable or low hippocampal volume/TIV and NAA/mI. hipp. vol. = hippocampal volume; mI = myo-inositol; NAA = N-acetylaspartate; TIV = total intracranial volume.

