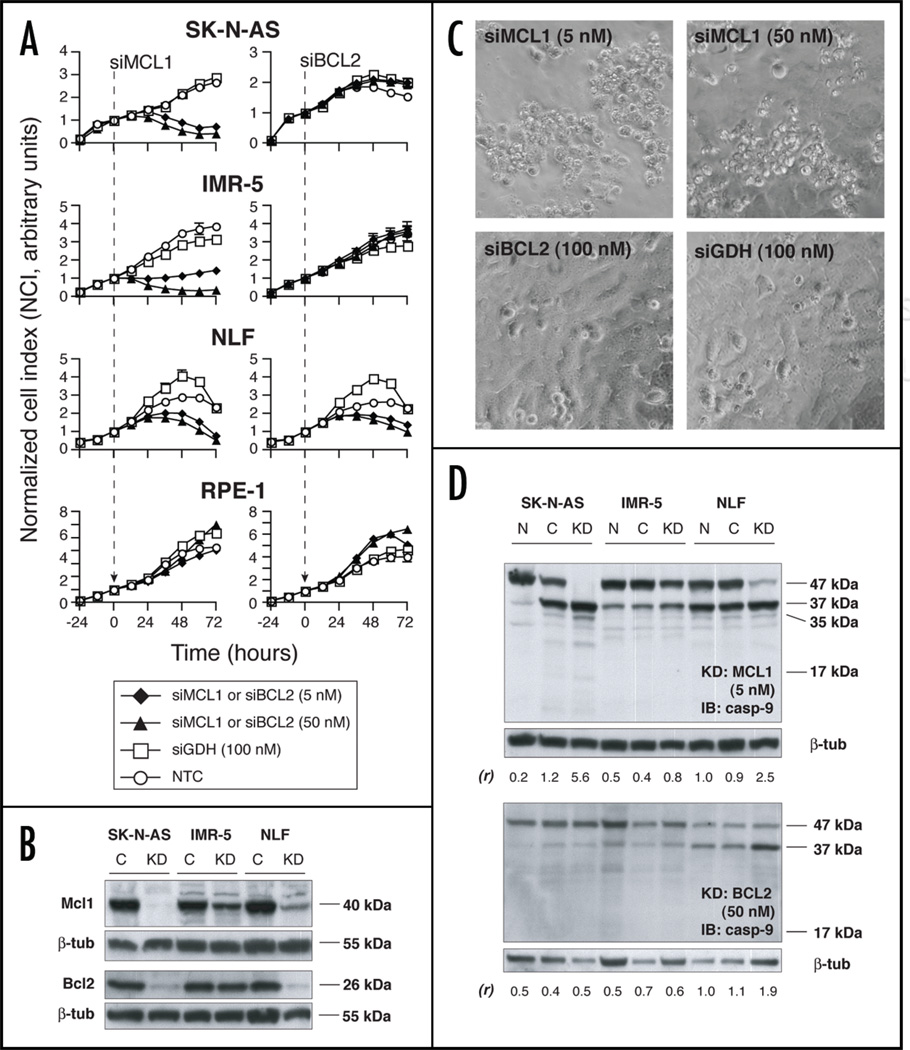
Figure 2.
(A) siRNA knockdown of Mcl1 (left) and Bcl2 (right) in NB cell lines and in the control cell line RPE-1 (♦ = 5 nM siMCL1 or siBCL2; ▲ = 50 nM siMCL1 or siBCL2; □ = 100 nM siGDH; ○ = nontreated control, NTC). Graphs are representative of at least 2 independent experiments, and depict mean of duplicate wells ±SEM (error bars may be smaller than symbol). (B) Protein immunoblot showing effectiveness of translational inhibition in siMCL1 or siBCL2-treated cells (knockdown, “KD”) versus siGDH-treated control (“C”). siRNA concentrations were 5 nM for siMCL1 and 50 nM for siBCL2. (C) Phase contrast microscopy in siRNA-treated SK-N-AS demonstrates that siMCL1 treatment resulted in a refractile, fragmented cellular morphology (upper). In contrast, cell monolayers grew to confluence and exhibited normal morphology with both siBCL2 and siGDH treatment (lower). (D) Protein immunoblots showing caspase-9 cleavage in response to siRNA treatment. Upper: cells treated with siMCL1 (“KD,” 5 nM) demonstrate loss of full-length procaspase-9 (47 kDa) and increase in 37 kDa, 35 kDa and 17 kDa cleavage products versus NTC (“N”) and siGDH treatment (“C,” 100 nM). Lower: only NLF demonstrates increased caspase-9 cleavage with siBCL2 treatment (“KD”, 50 nM), consistent with cell growth assays. Ratios of the relative intensities of the 37 kDa/47 kDa bands are shown as (r), with higher (r) indicating a greater degree of caspase-9 processing.

