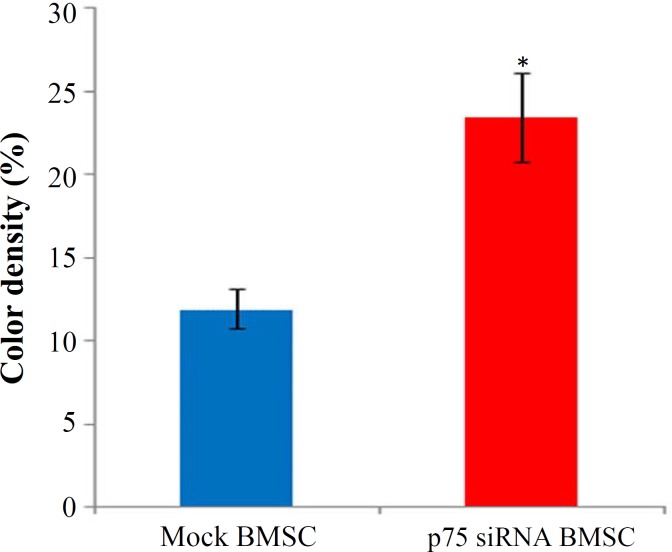
Fig. 3.
In vivo calculation of DiI florescent signal density at graft site. As it shows, the p75-siRNA-transfected cells generated more signal intensity compared to the mock-transfected cells; suggesting a better cell survival following p75 suppression. Error bars represent standard errors of the mean (*P<0.05

