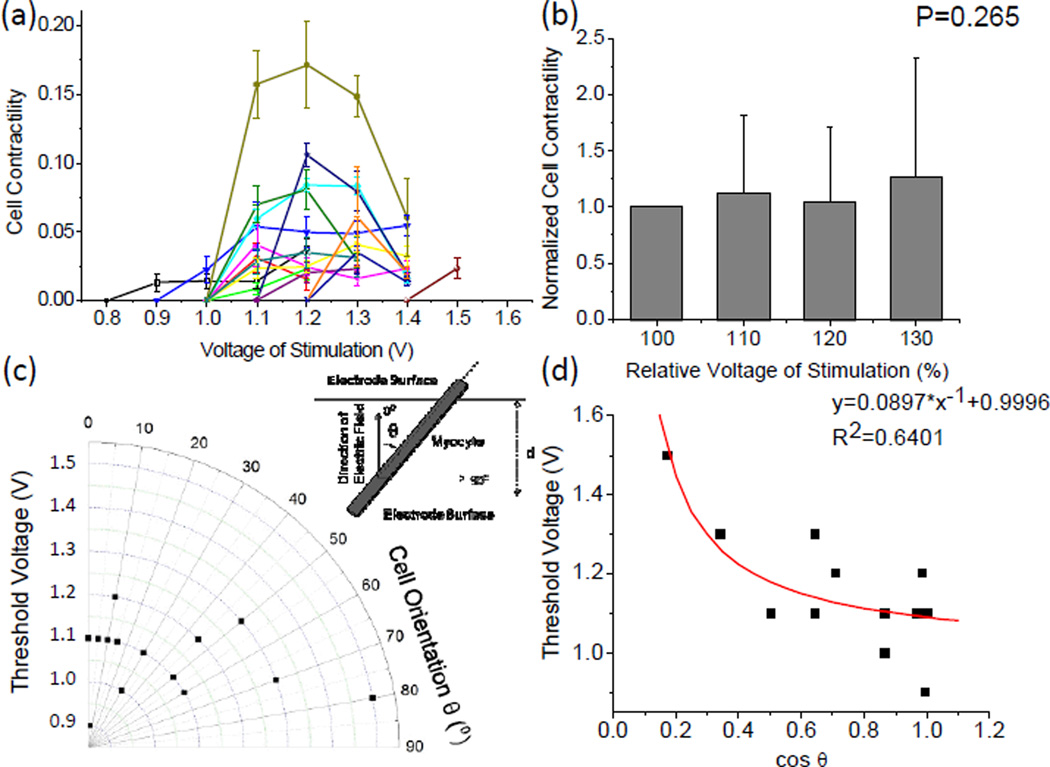
Fig. 6.
Characterization of cell contractility upon electrical stimulation. (a) Cell contractility as a function of the applied voltage. Each curve represents the data recorded from one cell. (b) Statistics showing the effect of applied voltage on the cell contractility. The stimulation voltage is presented as a relative value using the threshold voltage of each cell as the reference (100%). The normalized cell contractility is defined using the contractility of each cell at the threshold voltage as the reference. (c) Threshold voltage for inducing cell contraction as a function of cell orientation. Inset: definition of cell orientation (θ). (d) Threshold Voltage as a function of the cosine value of cell orientation with a nonlinear fitting curve.

