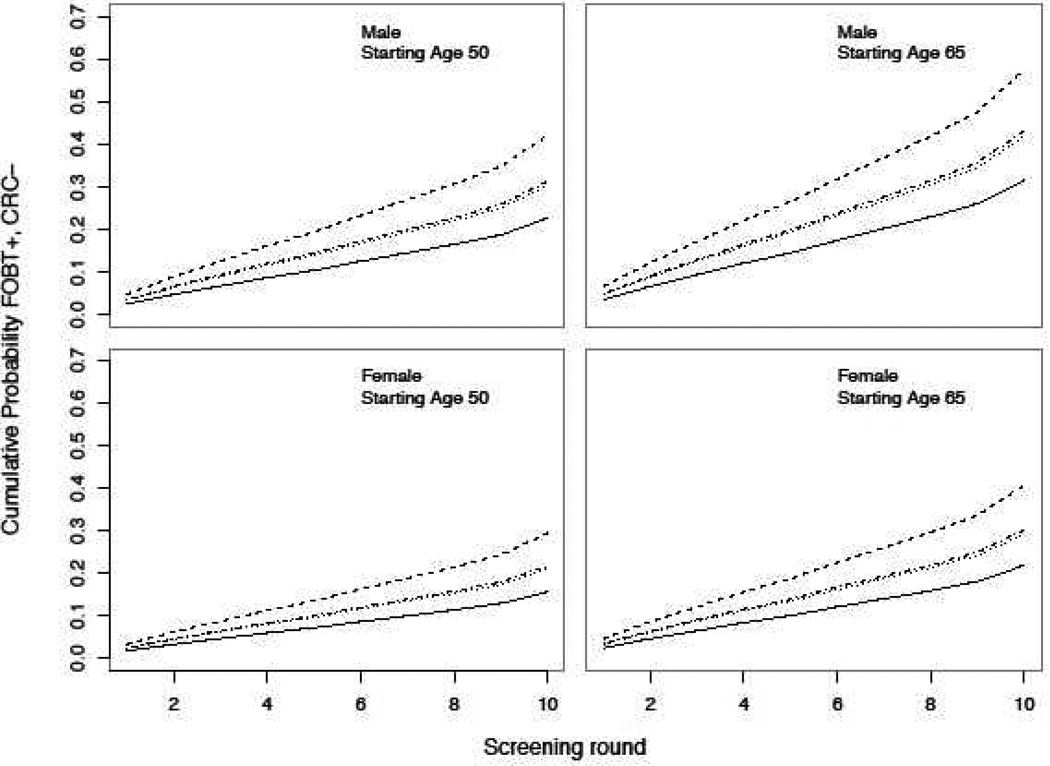
Figure 1.
Cumulative probability of receiving at least one FOBT+, CRC− result after 1 – 10 years of annual FOBT screening stratified by starting age, race, and sex. All estimates are based on risk levels for 2007 – 2009. Solid = white, dashed = Asian, dotted = black, dashed/dotted = American Indian/Alaskan Native.

